

Environmental mapping
The whole corridor, species by species, seep by seep.
Riparian species, cold water, bare earth under the brush and the record of what changed, mapped by drone LiDAR, multispectral and thermal for watershed councils, land trusts, consultancies and agencies.
The problem
A botanist can walk a mile. The corridor is twenty.
Restoration money is spent on what can be shown: which species hold the bank, where the cold water is, how the ground lies under the willows, and what the project changed. The people who know a reach best can walk a piece of it in a season. The report has to cover all of it, at the same standard, and again in three years.
A drone with the right sensors flies the whole corridor in days and measures it the same way end to end. The field work does not go away; it goes where it counts, training the species model and checking it, and every cold pocket the thermal finds becomes a point for the biologist to stand on.
What we map
Four questions, answered from the same flights
Vegetation and species
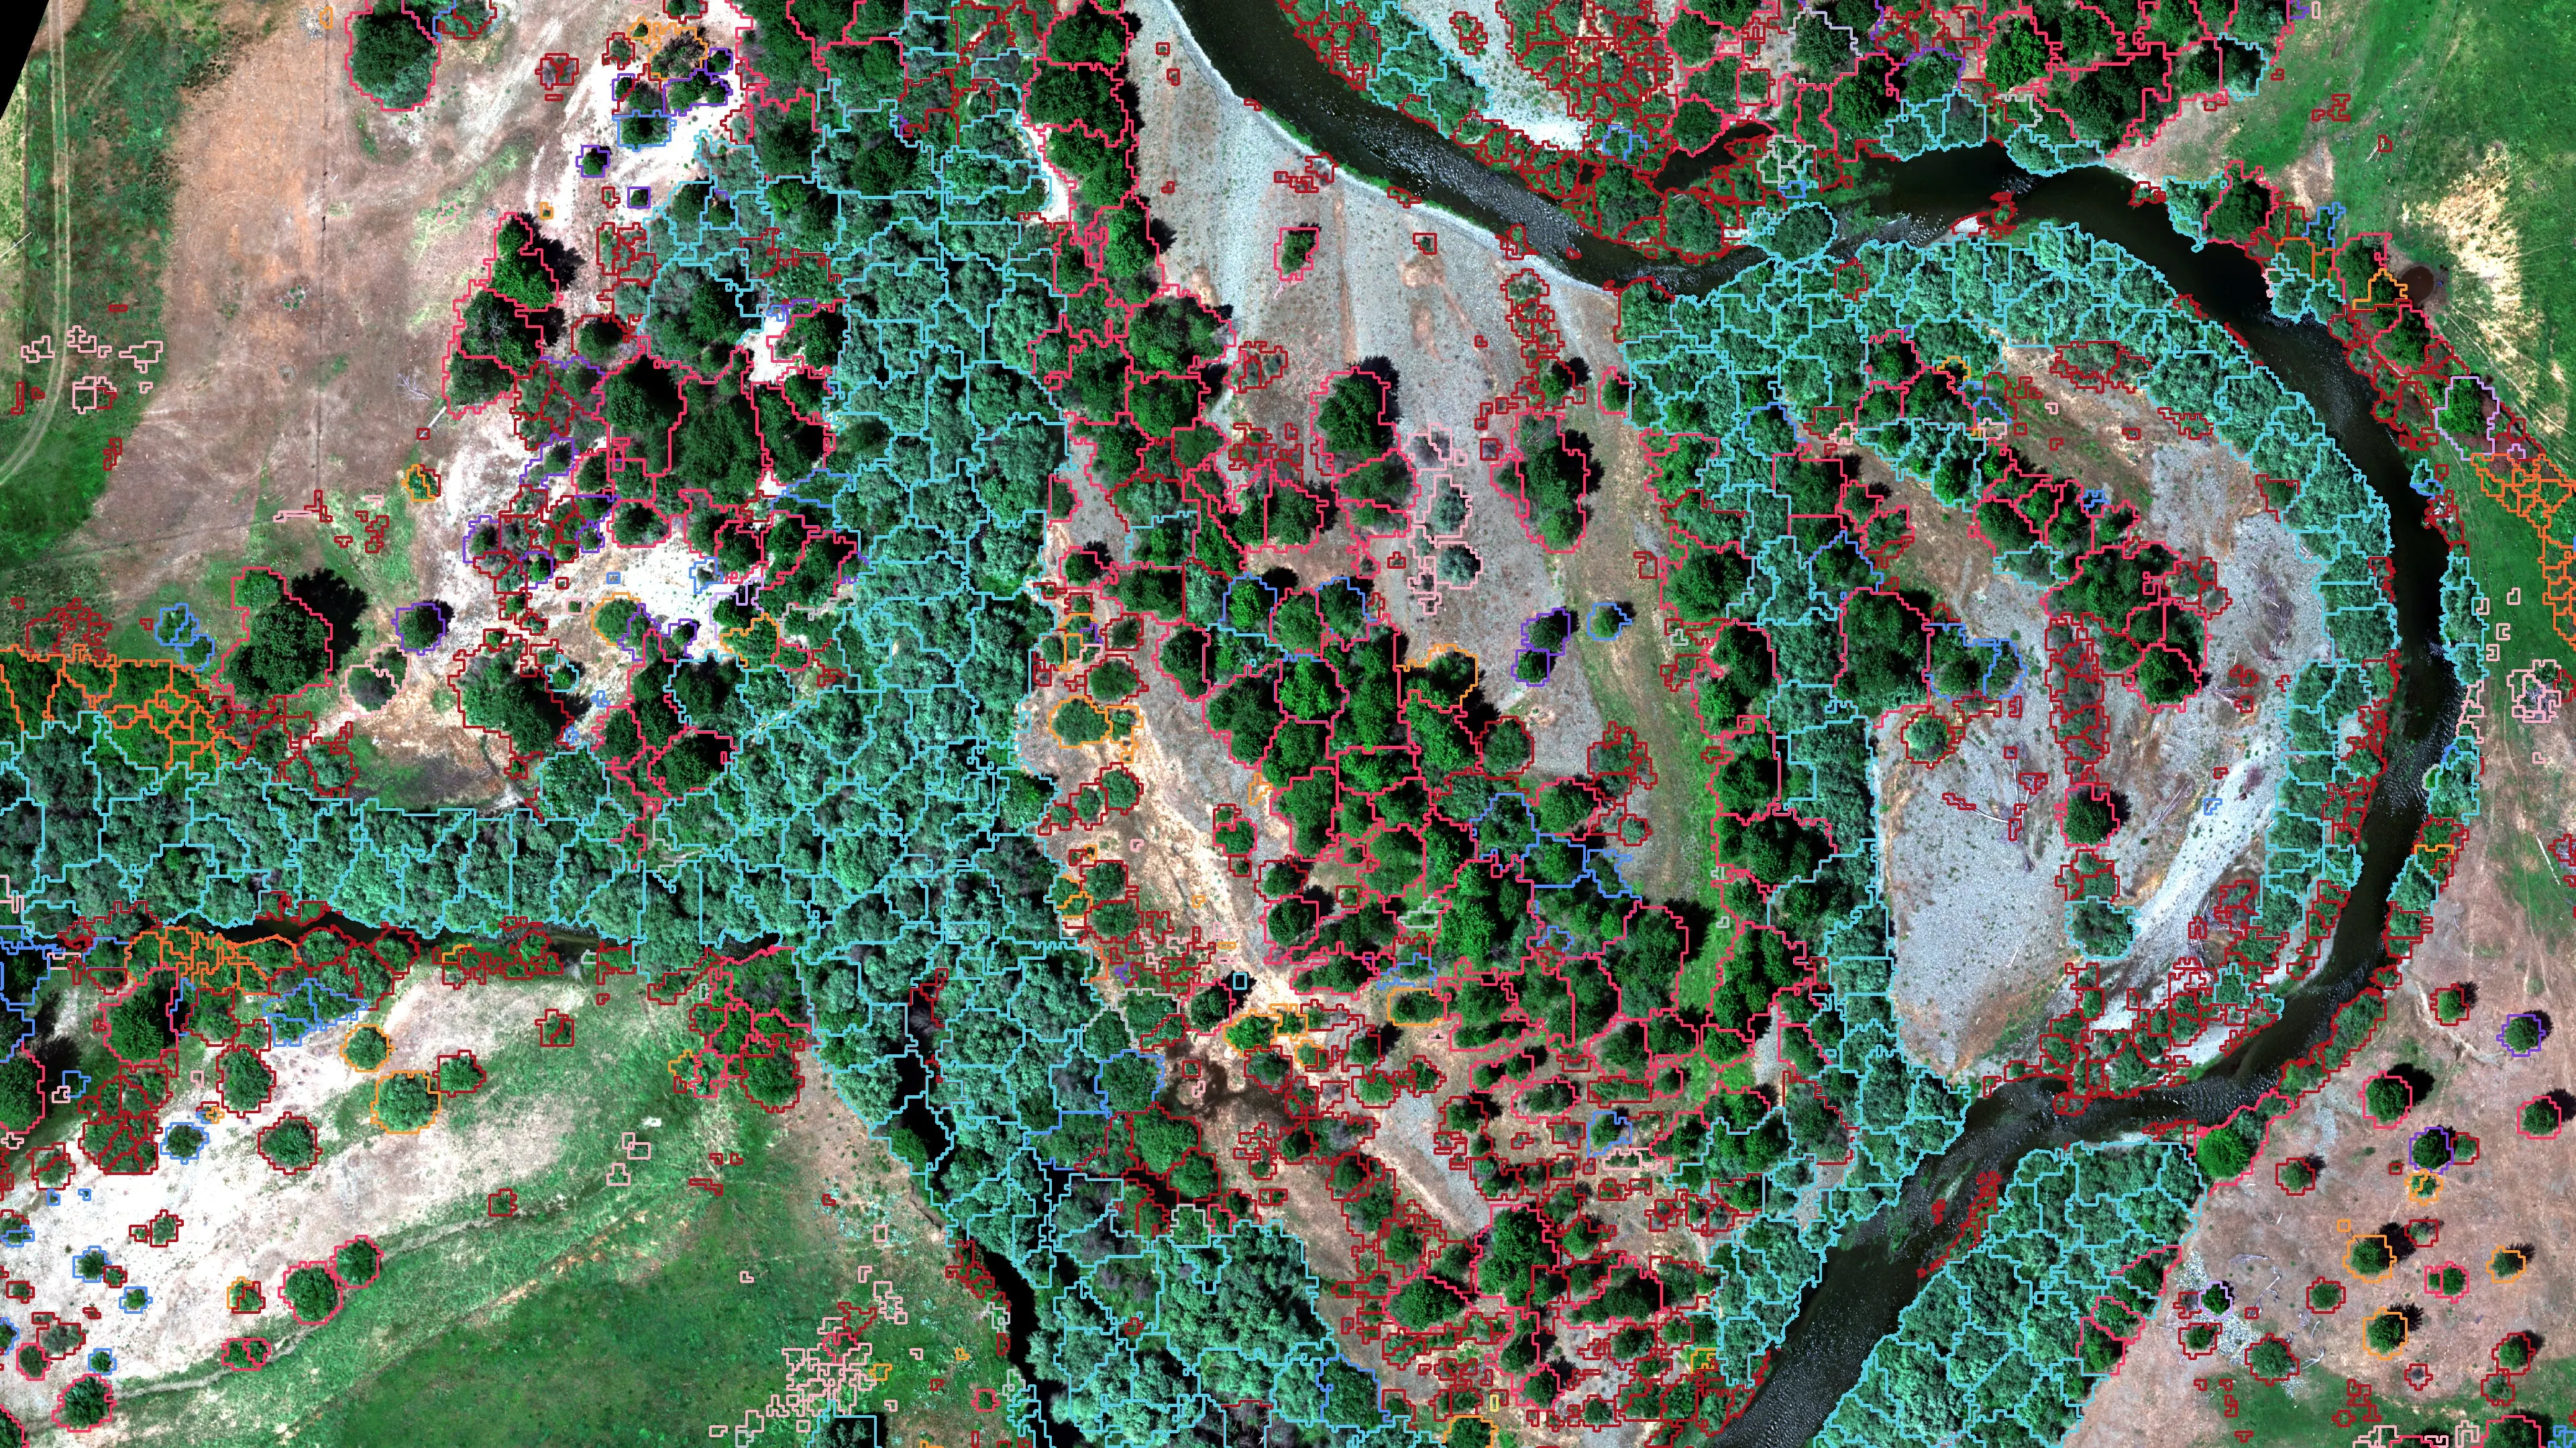
Canopy polygons by dominant species or vegetation class from multispectral imagery and LiDAR height, trained on the field samples your botanist already collects and checked on points held out of the training.
Water
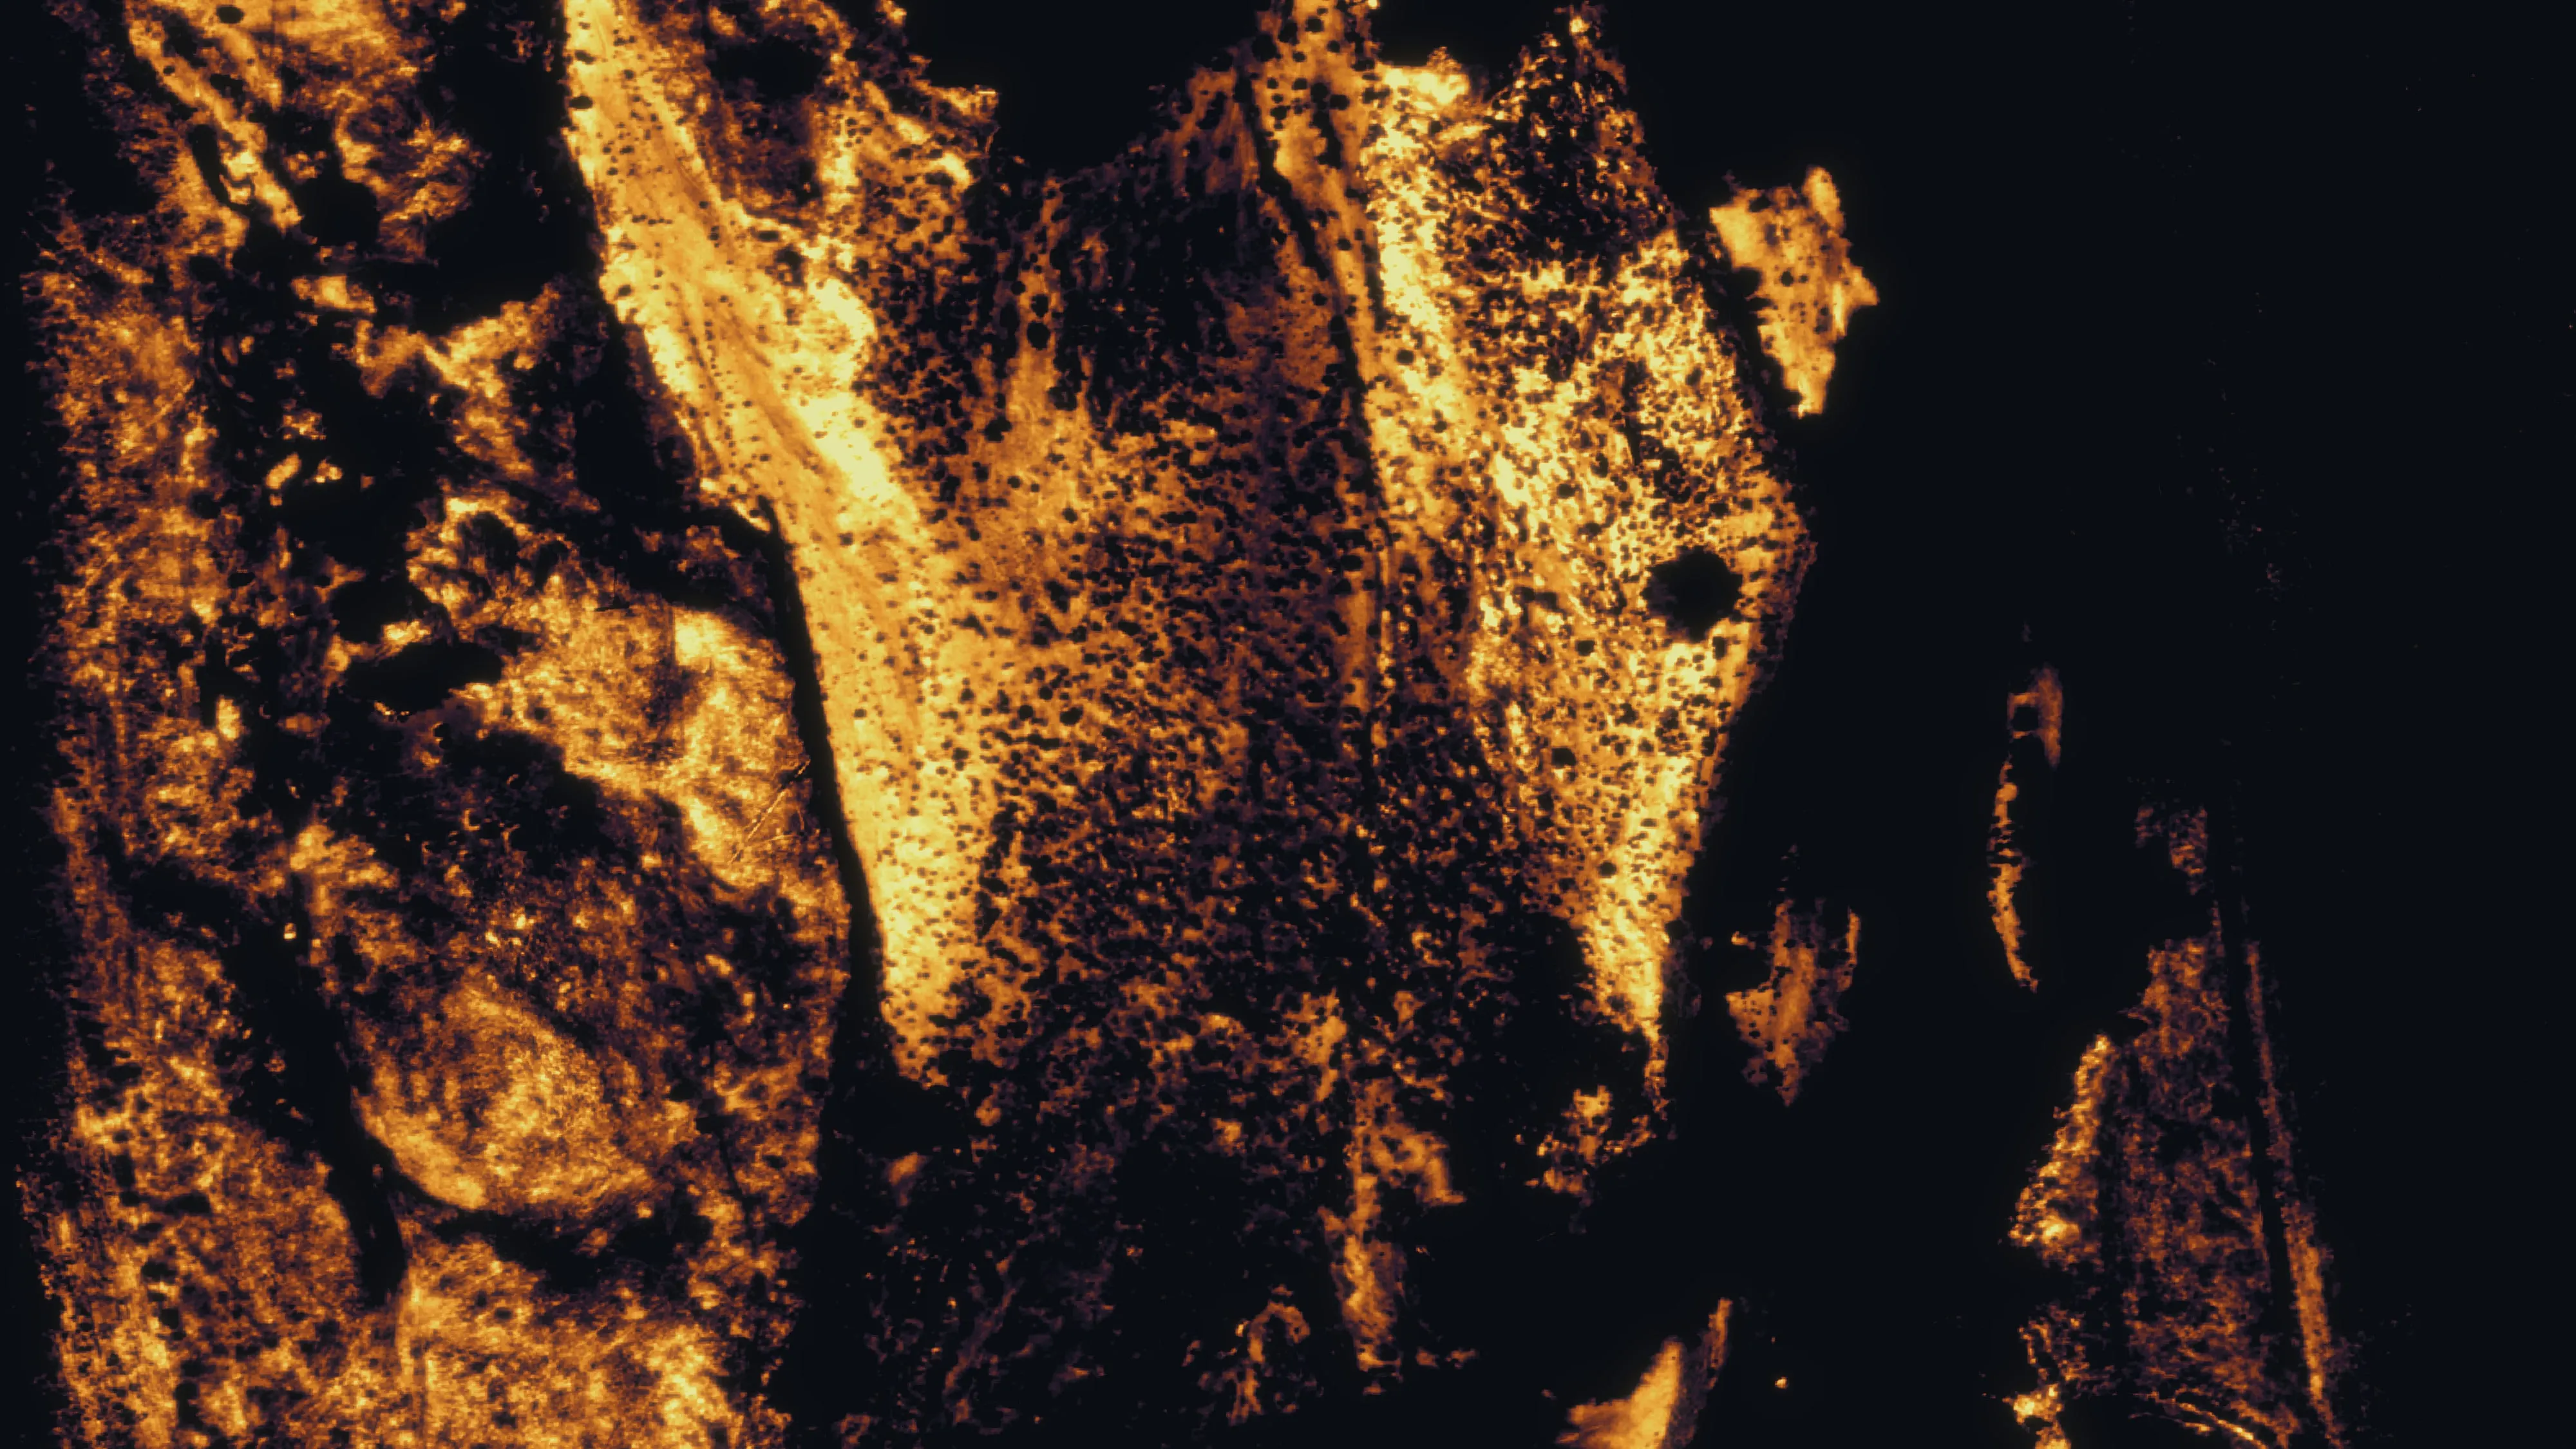
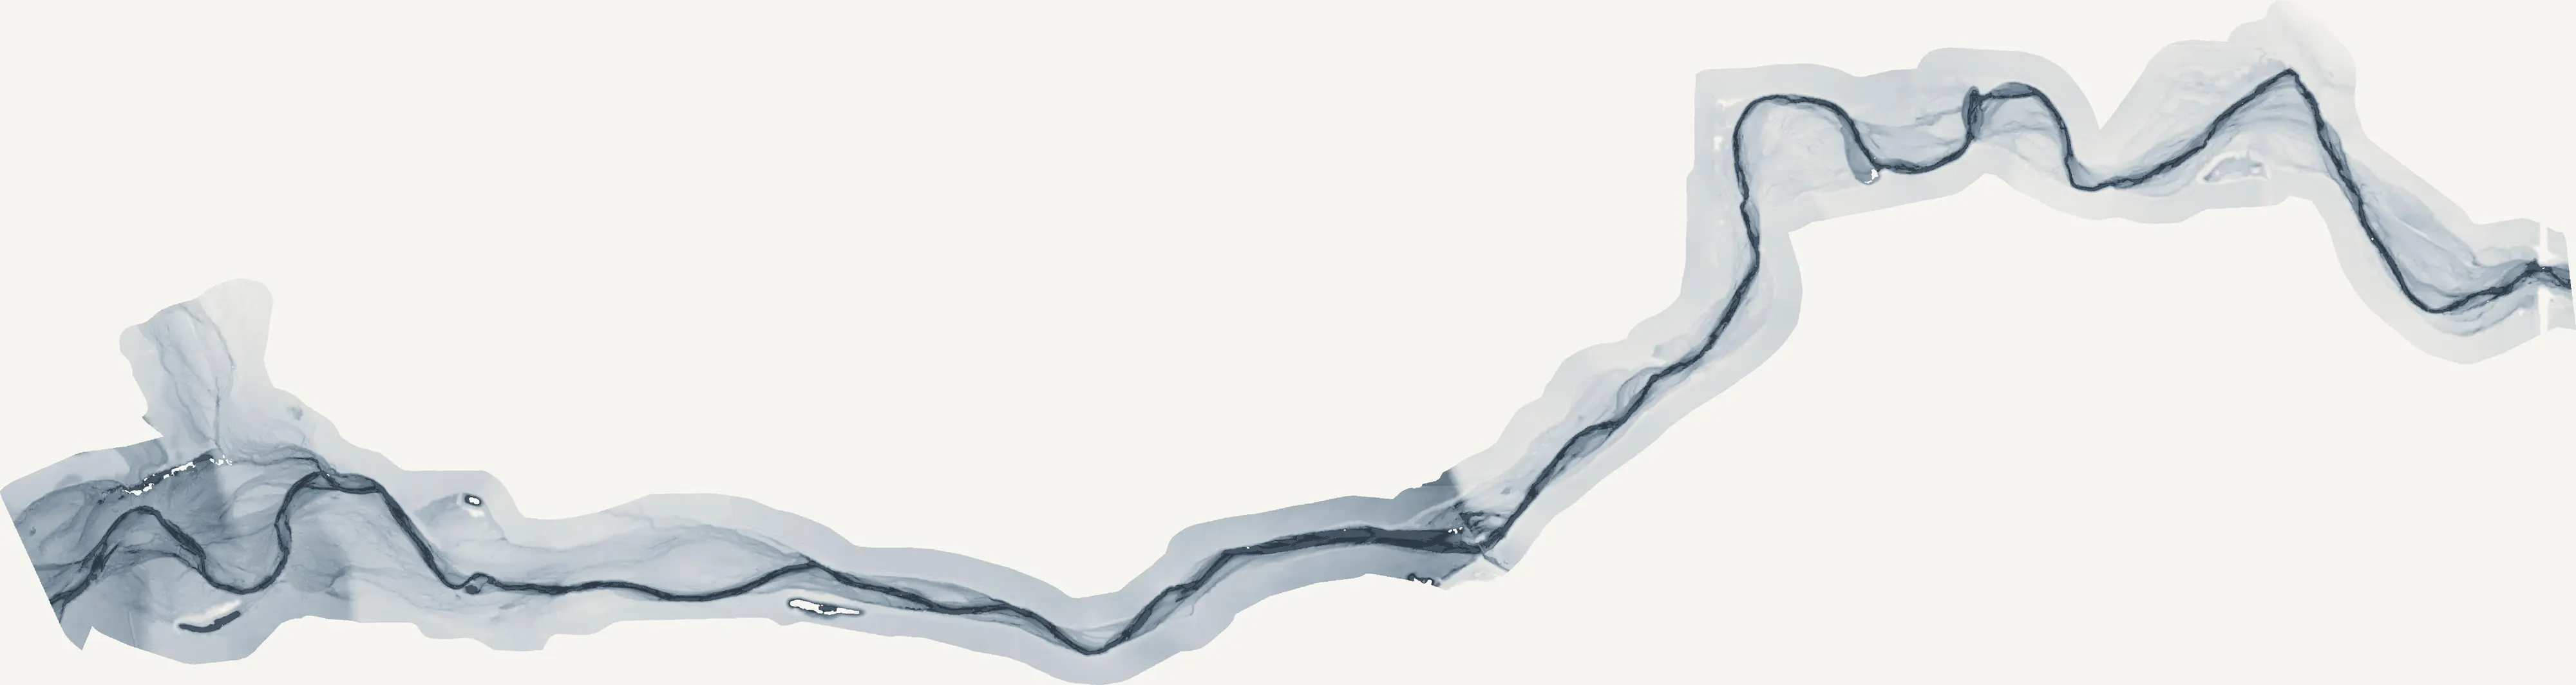
The wetted channel and the side channels from a water index; the cold pockets that point to groundwater inflow from morning and afternoon thermal flights; the relative elevation model that says how high every bank sits above the water.
Ground
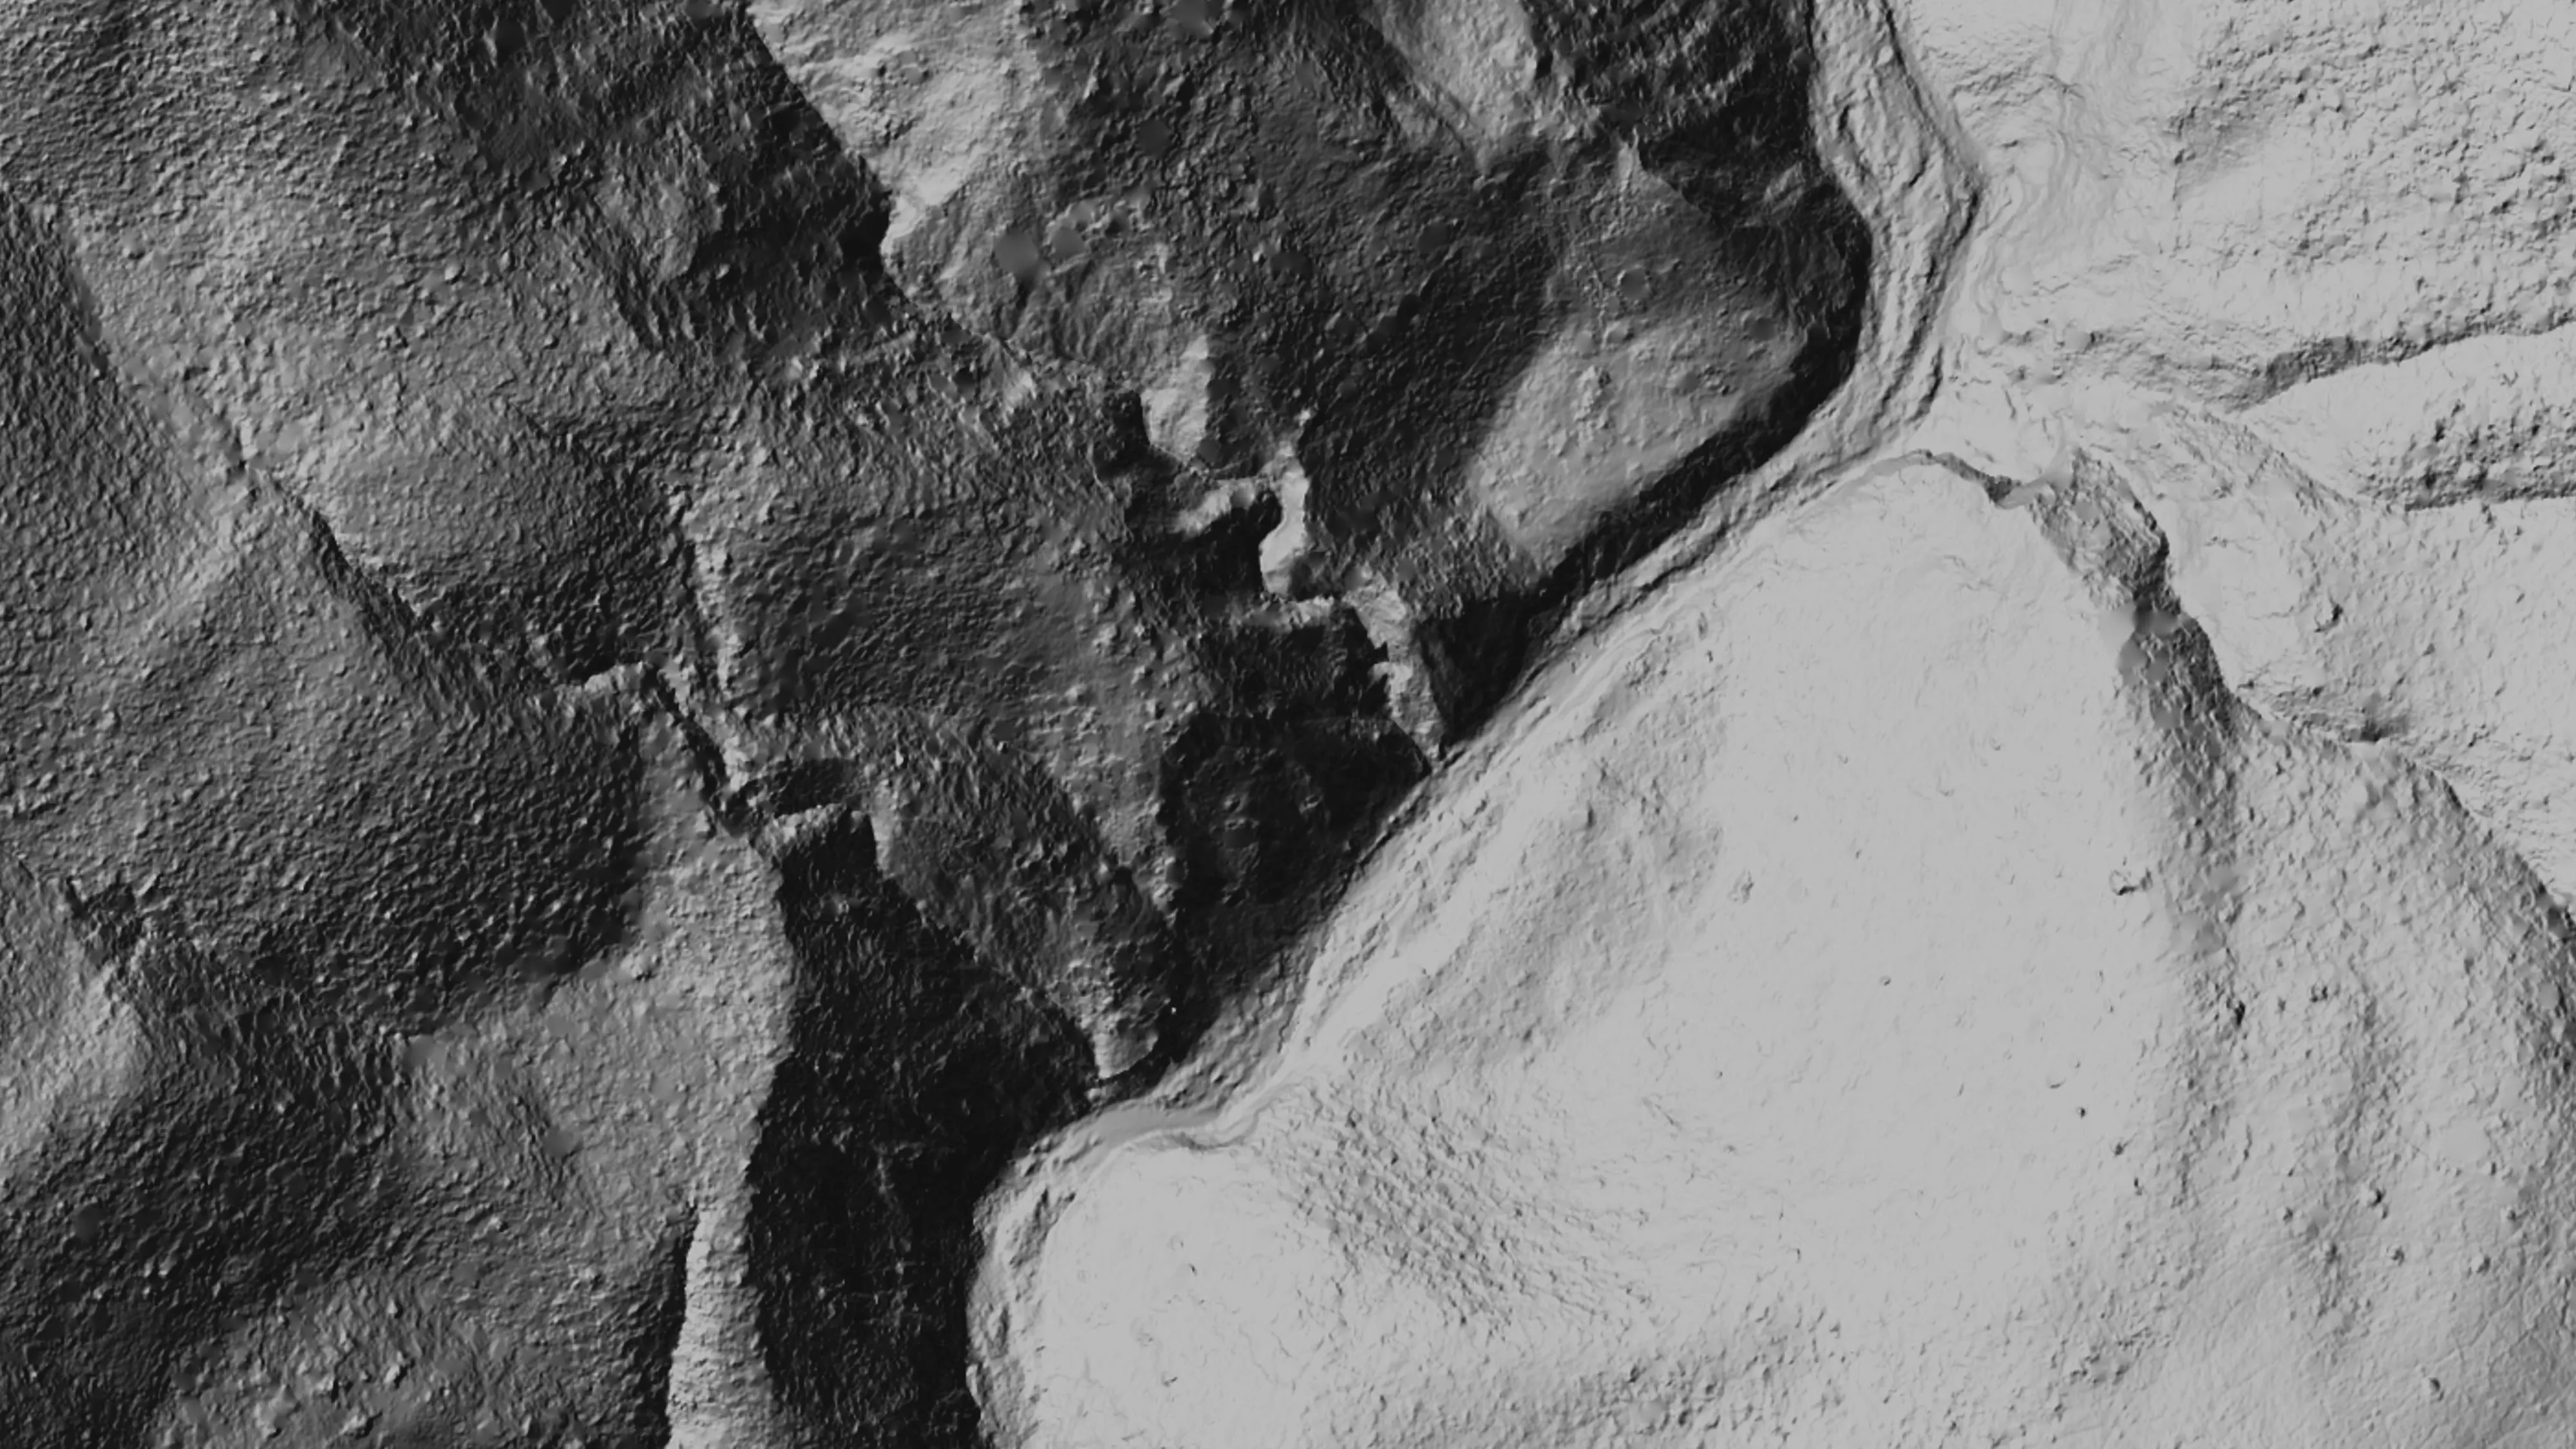
Bare earth under brush and canopy from LiDAR: the terrain a restoration design needs, the features a mine lands inventory has to find, the one foot contours a hydraulic model runs on.
Change
The same ground flown before the work, after the work and a year on. A planting counted tree by tree, a treatment measured, a bank that moved, in numbers a funder can read.
Scott River, 2025
Fourteen species and the cold water between them
For Cascade Stream Solutions we mapped 423 acres of the Scott River corridor: multispectral and thermal in July, RGB in September. Fourteen species classes, trained on 385 field samples the project botanist collected, came back at 77 percent overall and kappa 0.75 on 115 independent field points, with the willow and cottonwood groups above 85 percent.
Finding cold water was the part that mattered
Cold seeps are where the fish hold on in August. Flying the reach in the morning and again in the afternoon separates a pocket that is cold because groundwater feeds it from one that is only in shade. The botanist reviewed and corrected the species calls in an app we set up for the job, and those corrections went into the training before the final run.
BLM Ukiah, 2025
Bare earth under the chaparral at ten abandoned mines
For Bat Conservation International, on Bureau of Land Management ground in the Ukiah Field Office, we flew drone LiDAR over 779.4 acres of abandoned mine sites in four days in September 2025, under steep chaparral the public LiDAR could not see through at the detail the work needed. The bare earth came back at 0.25 m cells, with 837 points per square meter at the densest site, and checked against the BLM and USGS LiDAR on 242 points across eight sites at 0.320 m vertical RMSE. The habitat question and the hazard question were answered from the same ground model.
Restoration, year one
A planting is judged over years. The record starts now.
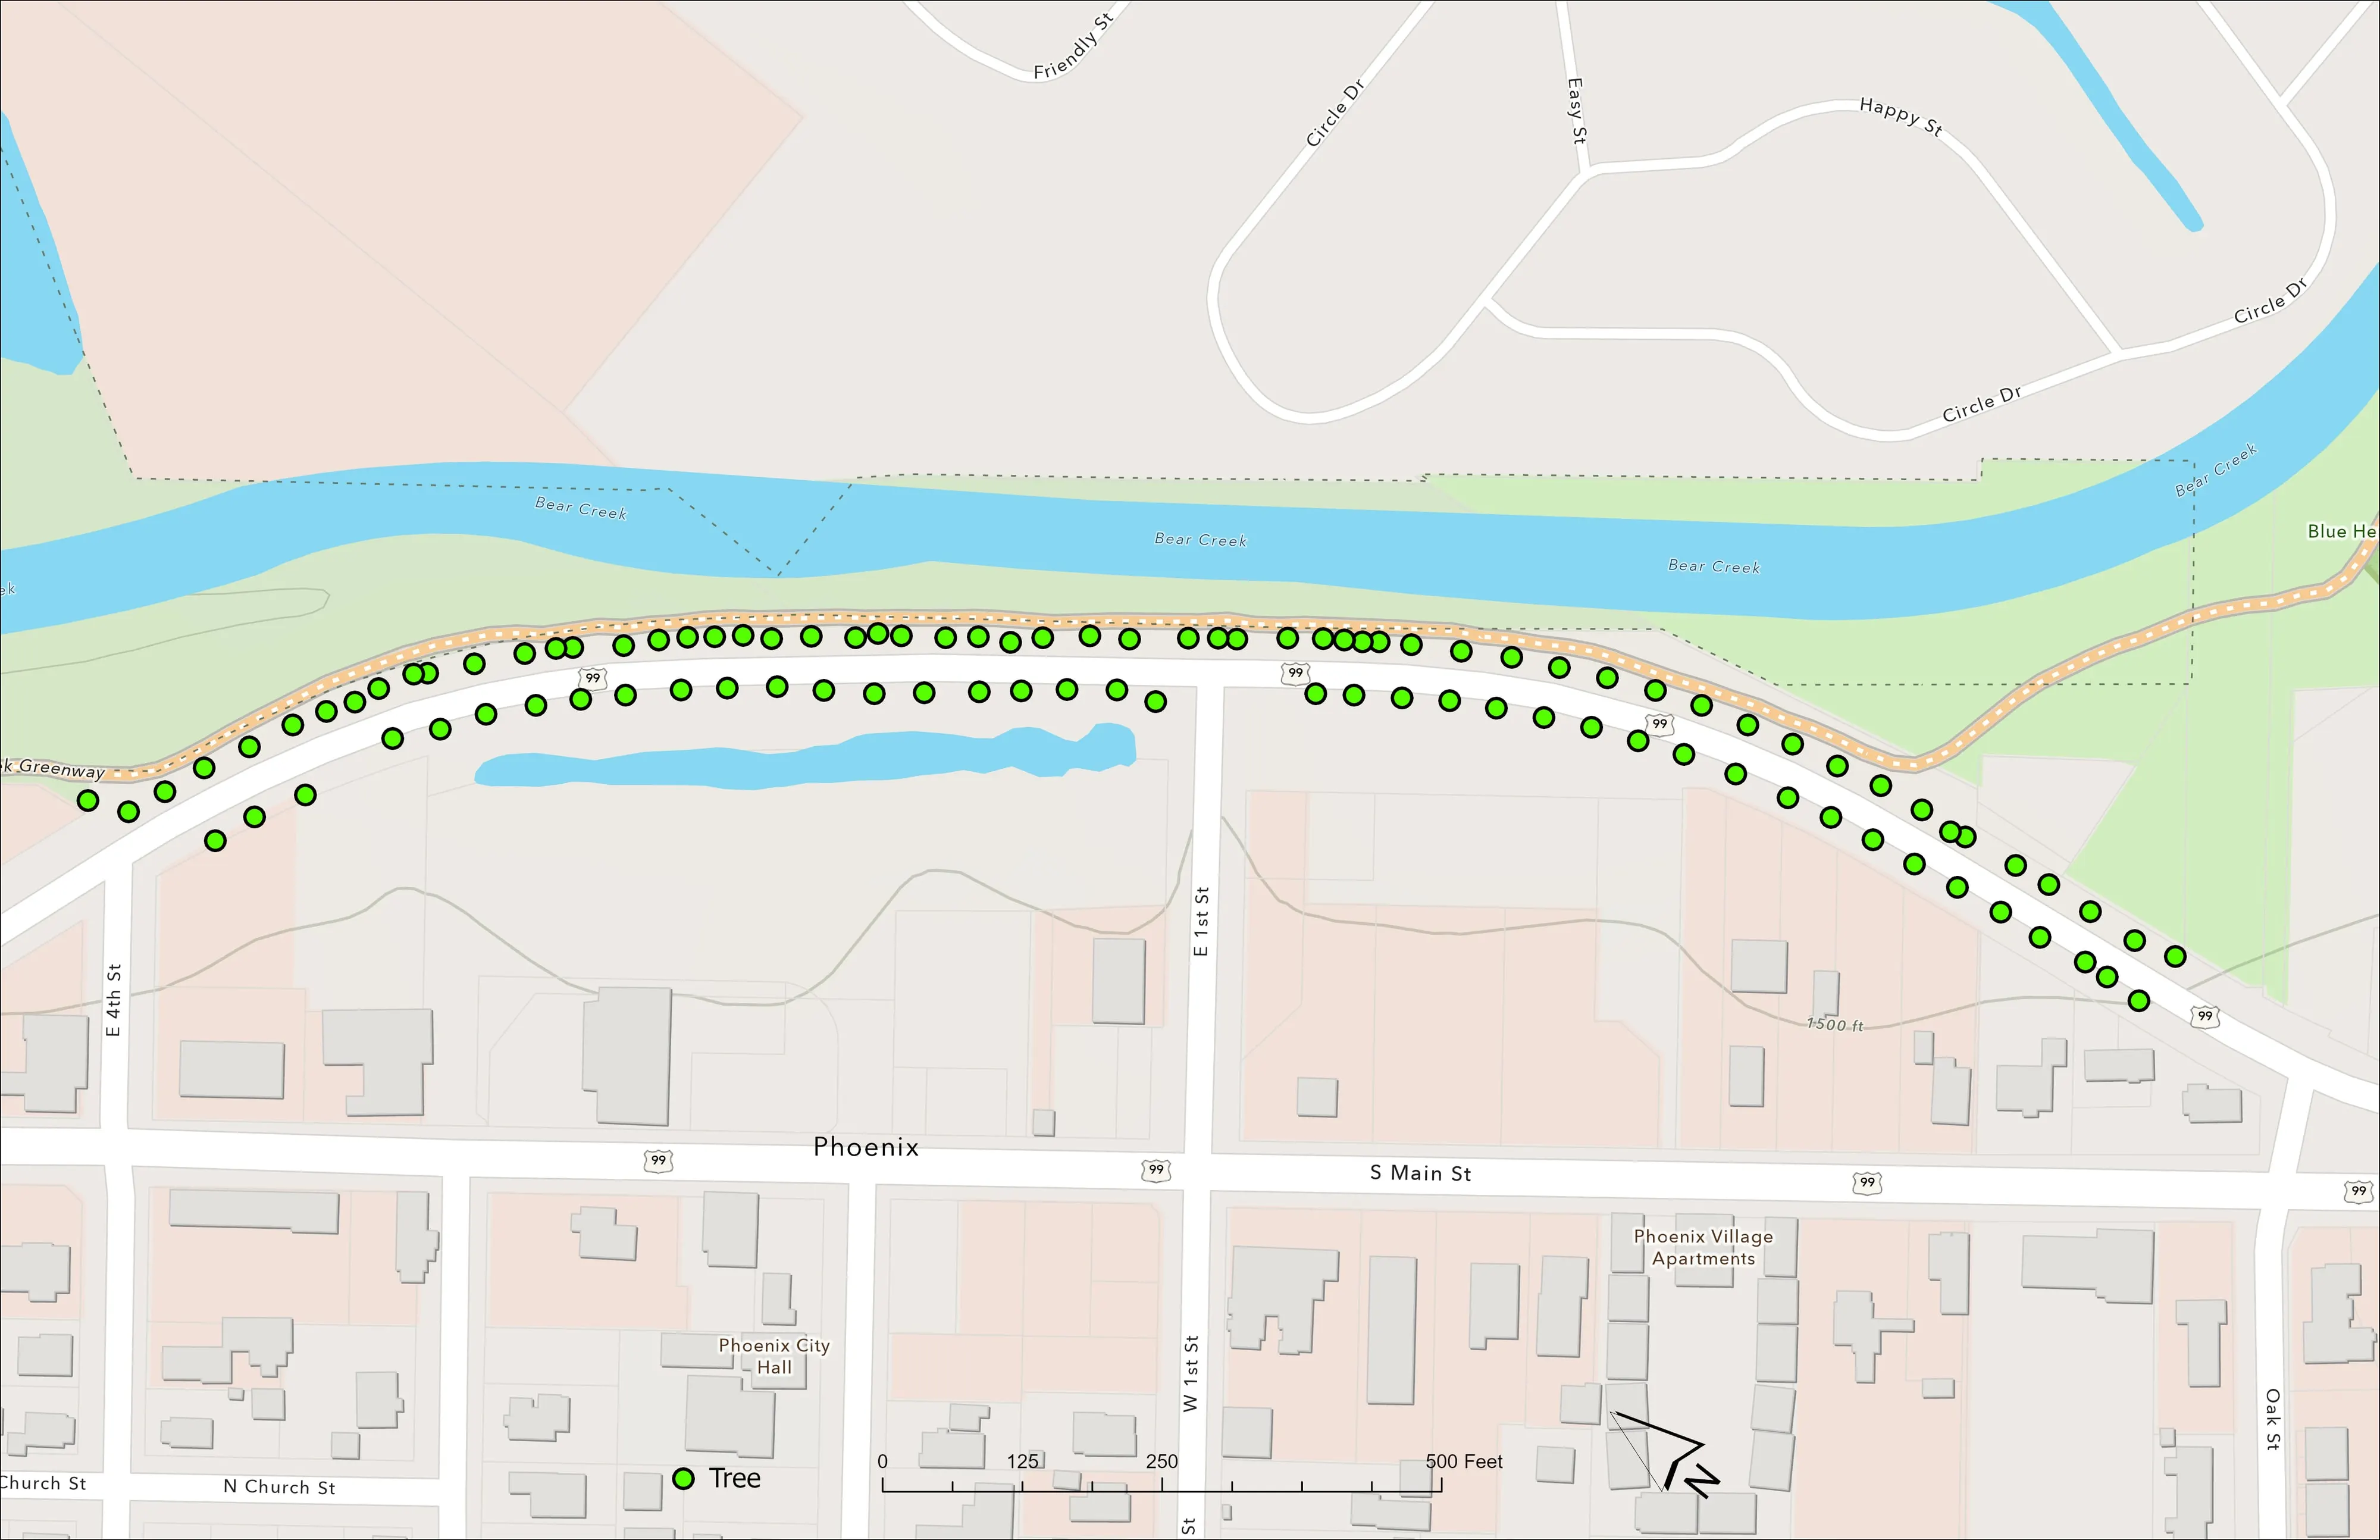
The City of Phoenix planted 98 trees along a corridor the Almeda fire burned through in 2020. We flew it 65 days later: ground, canopy, an orthomosaic, and every tree as a point and a polygon with its height and canopy area. Flown again, the record says which trees grew and by how much, which is what a funder's report asks and what a memory cannot answer.
What you get
Deliverables
- Species and vegetation class polygons with an accuracy statement on independent field points
- Thermal mosaics and the relative temperature raster, with the cold pockets as points to check
- Relative elevation model, bare earth, canopy height and one foot contours
- Orthomosaic, colour infrared and water index from the same flight
- A review app for the project botanist or biologist, so corrections come back as data
- Everything in your schema and coordinate system, as a geodatabase, shapefiles, rasters and hosted layers
Who it is for
- Watershed councils and the restoration contractors that work for them
- Land trusts and conservancies reporting on the ground they hold
- Environmental and stream consultancies that need the whole corridor mapped, not the reach they can wade
- Federal and state land managers with habitat, mine lands or riparian questions
- Cities and counties with a greenway, a floodplain or a planting to account for
- Researchers who need a measured baseline before the treatment
Species are read from imagery flown when the species separate, which on a river in Oregon or northern California is usually July for the canopy and October for the ones that turn. Thermal wants a clear morning and the same afternoon. Say what the question is and the flights go on the right days.
The same ground, other questions
Riparian buffers, fuels and the GIS behind it
On a post harvest unit for the Oregon Department of Forestry the same flights counted and measured every log across 32.7 acres of upland and 18.1 acres of riparian management area, with the standing trees identified to species at 94 percent on the field checks. The fuels question a wildfire plan asks starts from the same canopy data, and the hosted layers and review apps that make the data usable are built here too.
Downed woody debris for ODF Fuels mapping and CWPP support GIS consulting
Send us the reach and the question.
A boundary or a river mile range, the species or the water you care about, and when the report is due. We will come back with the flights, what they answer and what it would cost.
Email info@roguerecon.net or call 808 298 6290.