

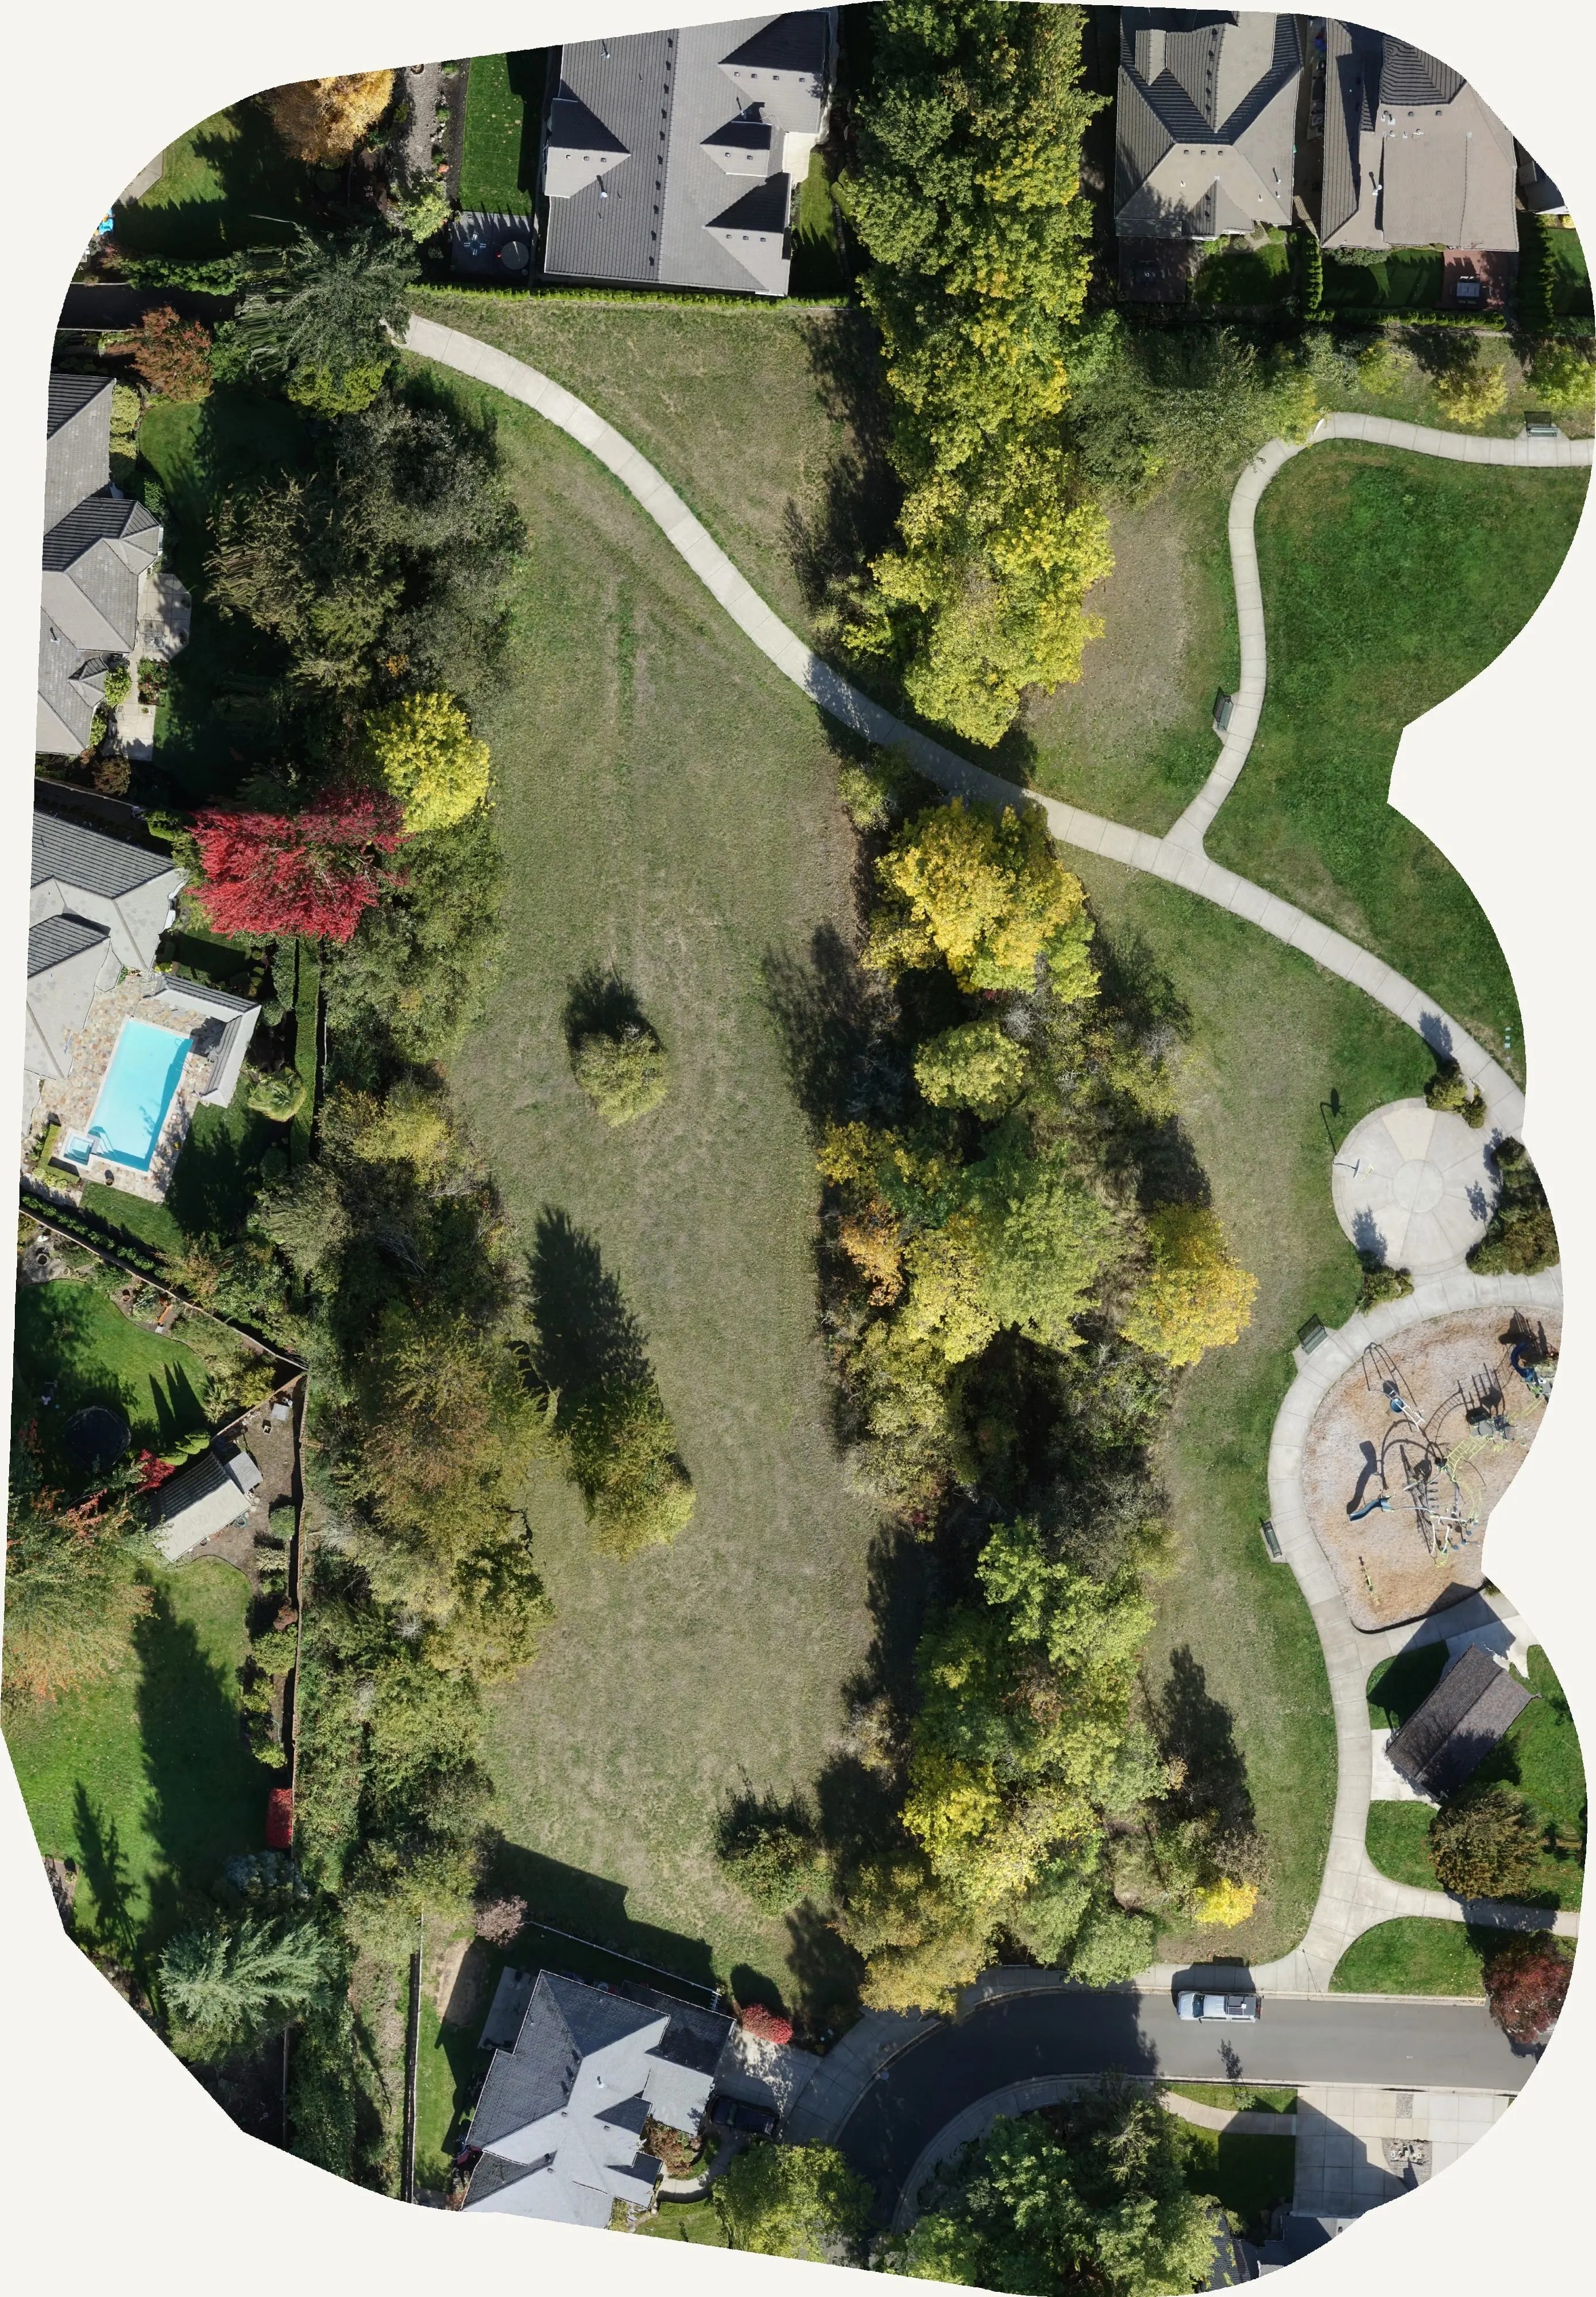
Tree inventory
Every tree in town, counted from the air.
Crown by crown inventories for cities, parks and campuses from drone LiDAR and multispectral: species, height, health and canopy cover, checked against trees on the ground. The City of Eugene's Oregon ash inventory is the proof.
The problem
A walking inventory takes years and ages as it is written
A city's trees are an asset, a liability and a budget line, and most cities cannot say how many they have. A street by street inventory takes a crew years, covers the public trees it can reach, and is out of date on the side of town it finished first. Parks, natural areas, campuses and the trees behind fences never make it in at all.
Emerald ash borer turned the question from "someday" into a deadline. It was first found on the West Coast in Forest Grove in 2022, and by August 2026 it was confirmed in Multnomah, Clackamas, Yamhill and Marion counties. Oregon's forestry officials expect the state could lose up to 99 percent of its ash over time. A city that does not know where its ash trees are cannot decide which to treat, which to remove, and what the next ten years cost.
What the air sees
Four layers, one flight season
An inventory from the air is not a photograph with dots on it. It is a measured crown for every tree, a species and a health call on each one, and a ground check that says how often the calls are right.
The crown
LiDAR finds every crown and measures its height and area. That is the record: one polygon per tree, with a treetop point, before anyone says what kind of tree it is.
The species
Multispectral imagery flown in the right season separates the species a city cares about. Oregon ash gives itself away in October, when it turns ahead of the canopy around it.
The health
The same imagery reads vigour. A living conifer throws back near infrared; a dying one does not. Crowns come back as healthy, declining, dieback or dead, with the confidence behind each call.
The ground check
Field visits go where the model is unsure, not everywhere. The checks are the accuracy statement, held out of the training, so the number we report is the number you would get.
Eugene, 2025
Finding every Oregon ash before the borer does
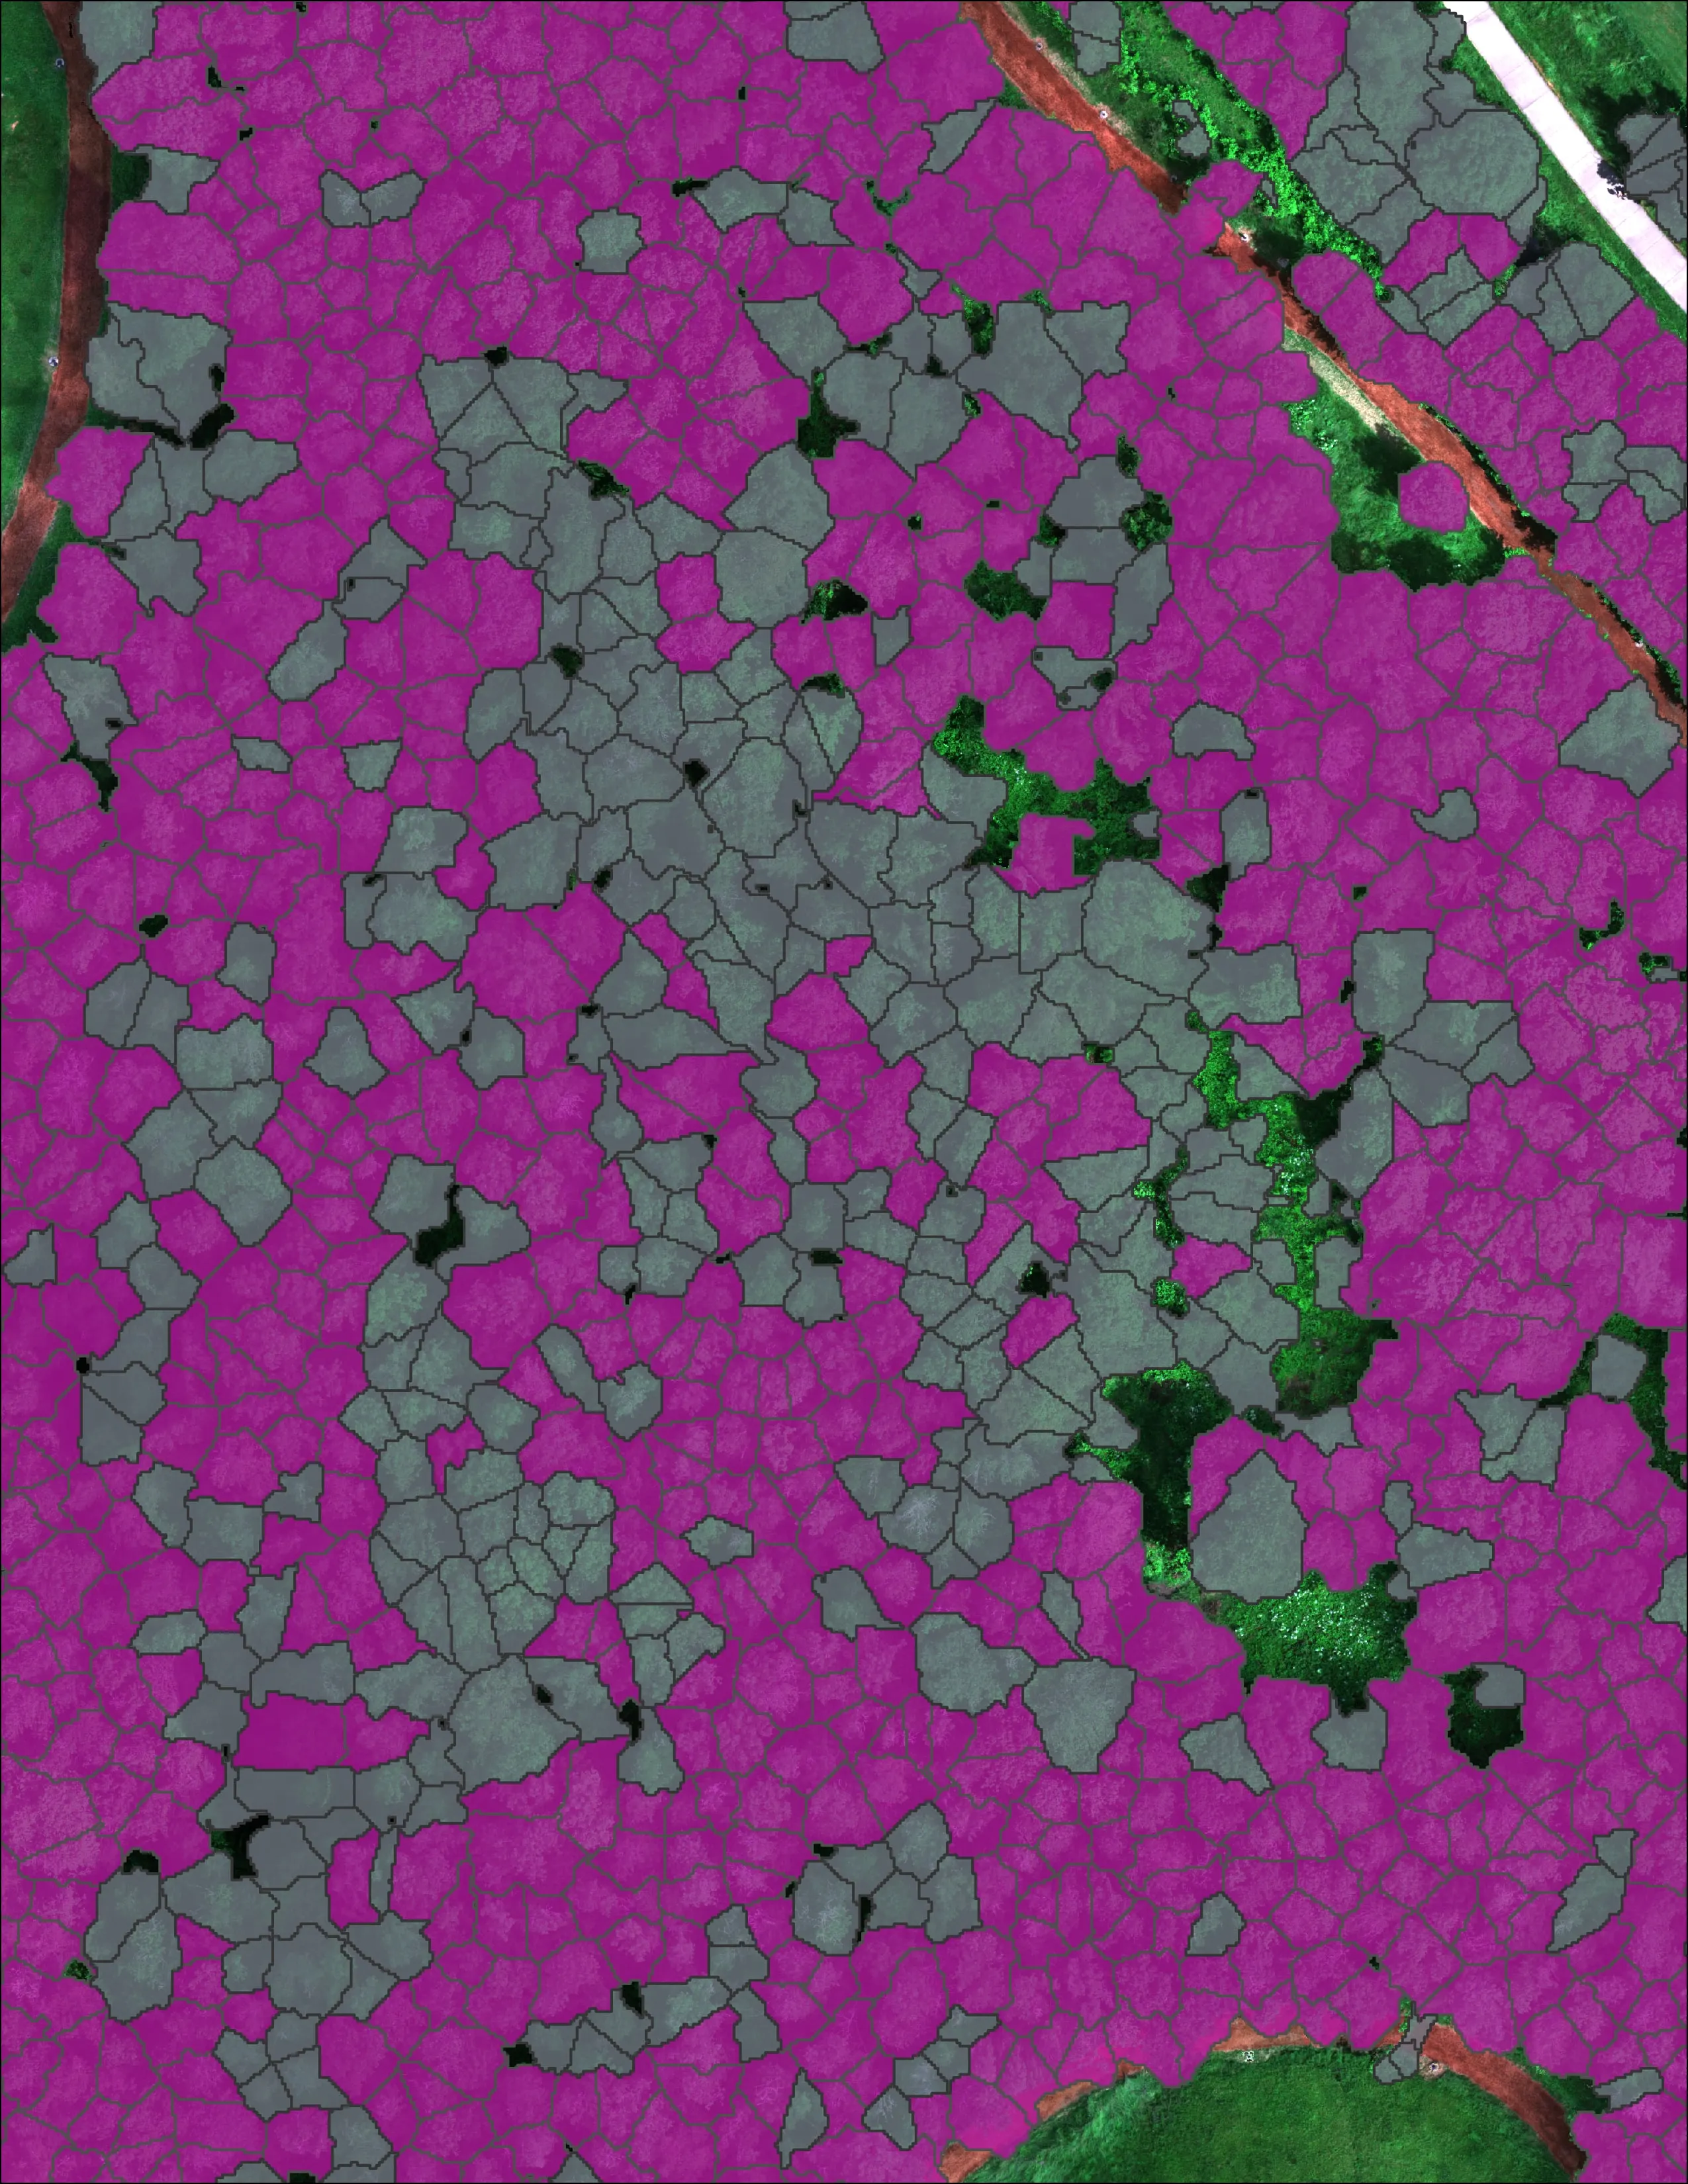
For the City of Eugene we mapped 390 acres across 13 designated areas and classified 12,632 crowns. 5,261 of them are Oregon ash.
The number we report
The map is 85 percent accurate overall, graded on 290 GPS checked crowns the model never saw: 74 percent of the ash found, 90 percent right on everything else. Every crown carries its species, height and the confidence behind the call, delivered as hosted map products the city's staff work from and a method the council can read.
The multispectral flight went up in October, when ash turns ahead of the canopy around it. Timing is most of the accuracy. The same trees flown in July look like everything else.
Health, not only species
Thirty thousand crowns, four health classes
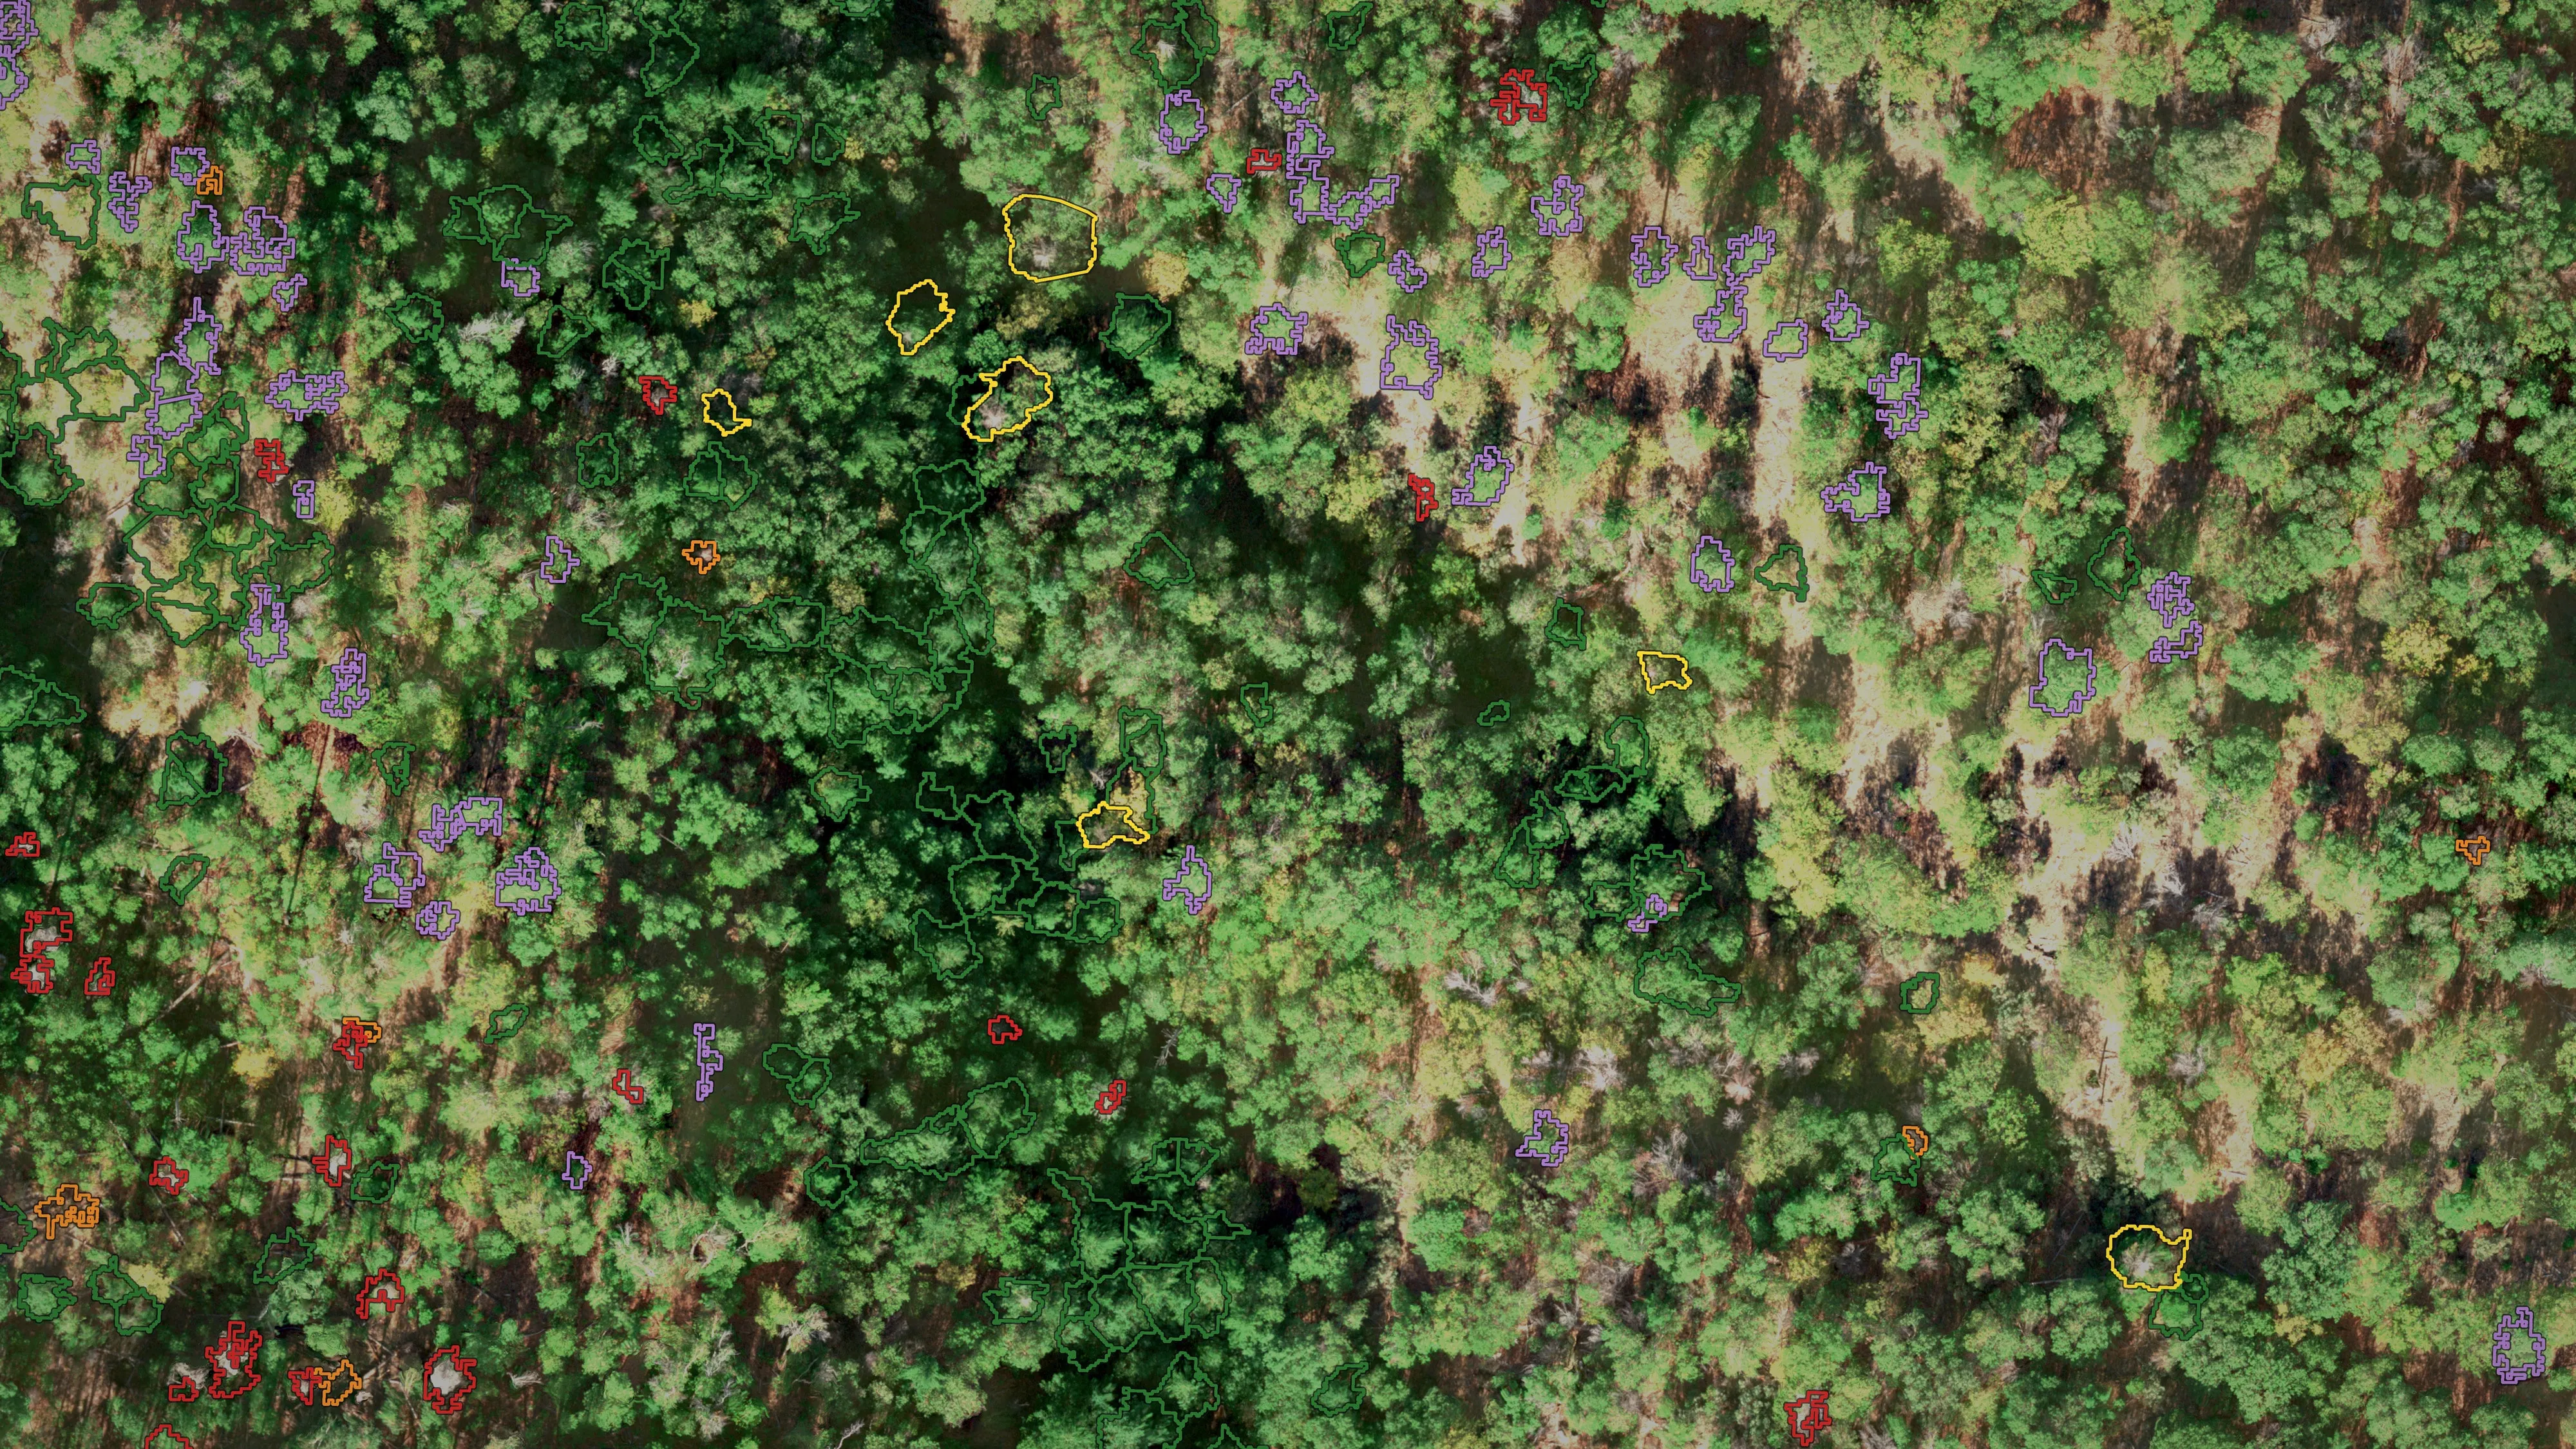
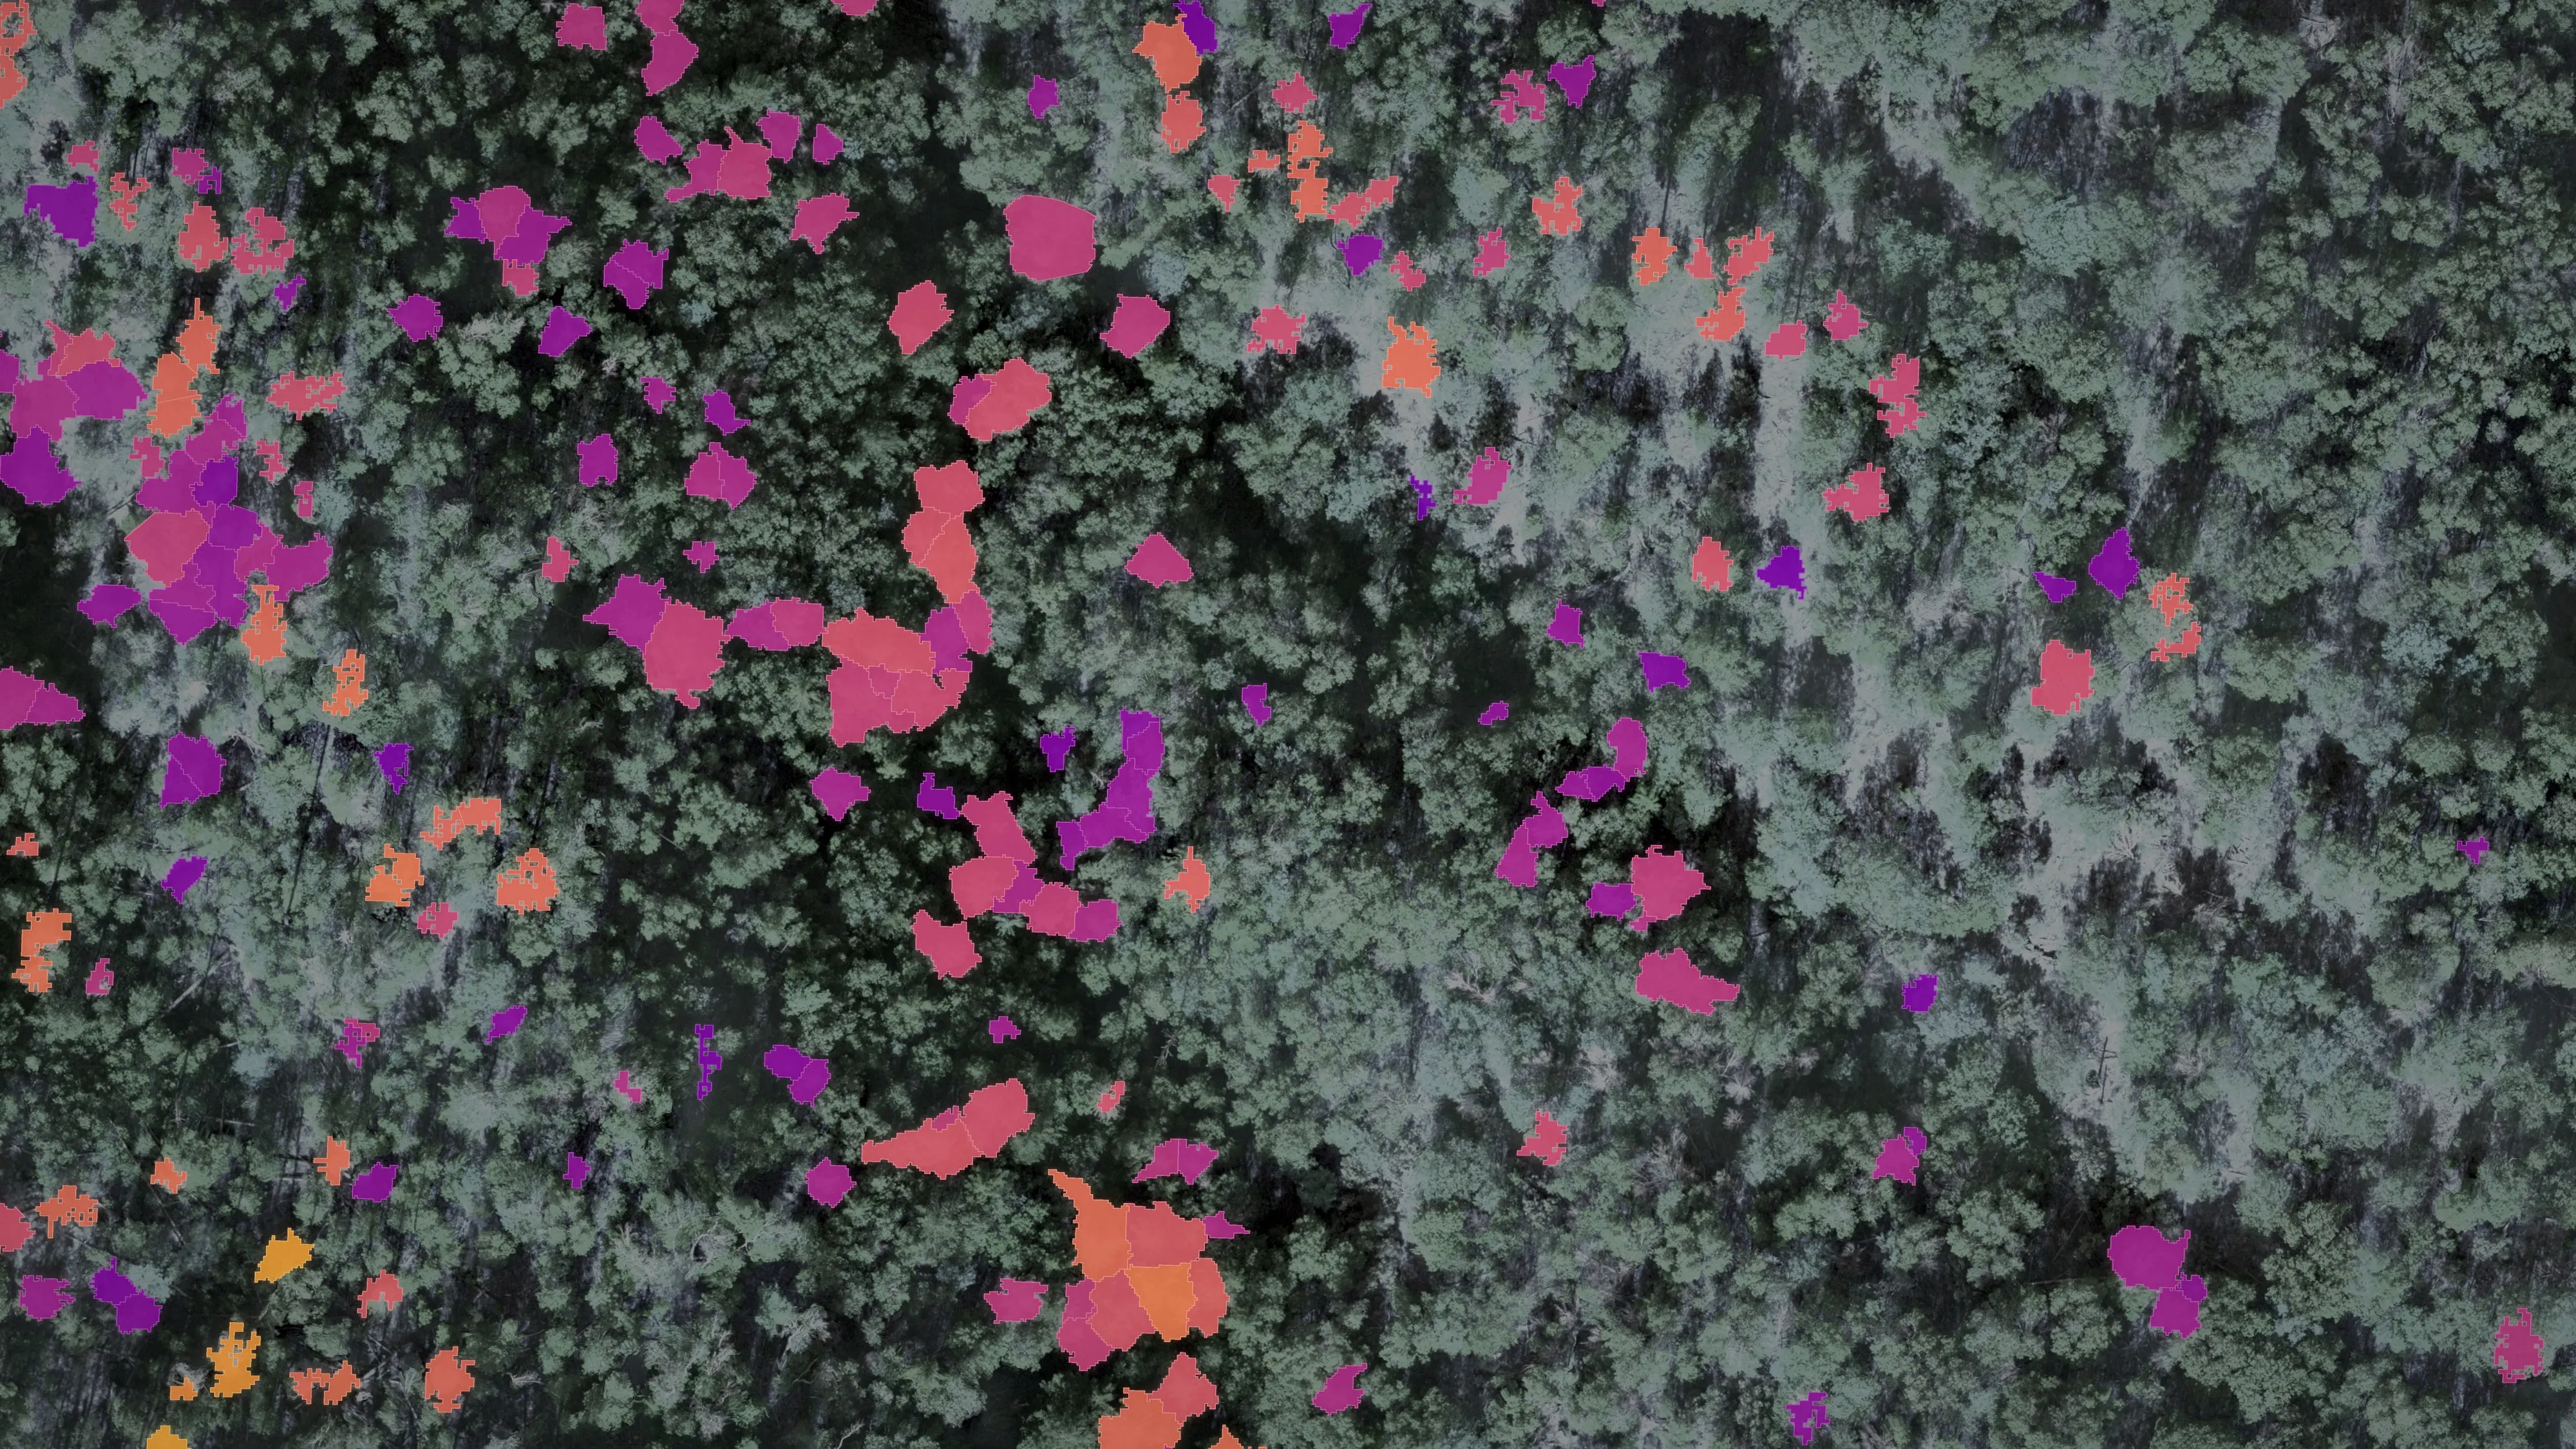
The same method reads what is dying. For the City of Ashland we classed 30,226 Douglas fir crowns across the city's watershed lands into four health classes, 1,997 of them dead, with ponderosa pine separated out. The 2023 baseline put 20.8 percent of the Douglas fir dead or declining; the city took the dead ones out by helicopter on about 400 acres the following spring.
Year one
A planting has to be counted from the start
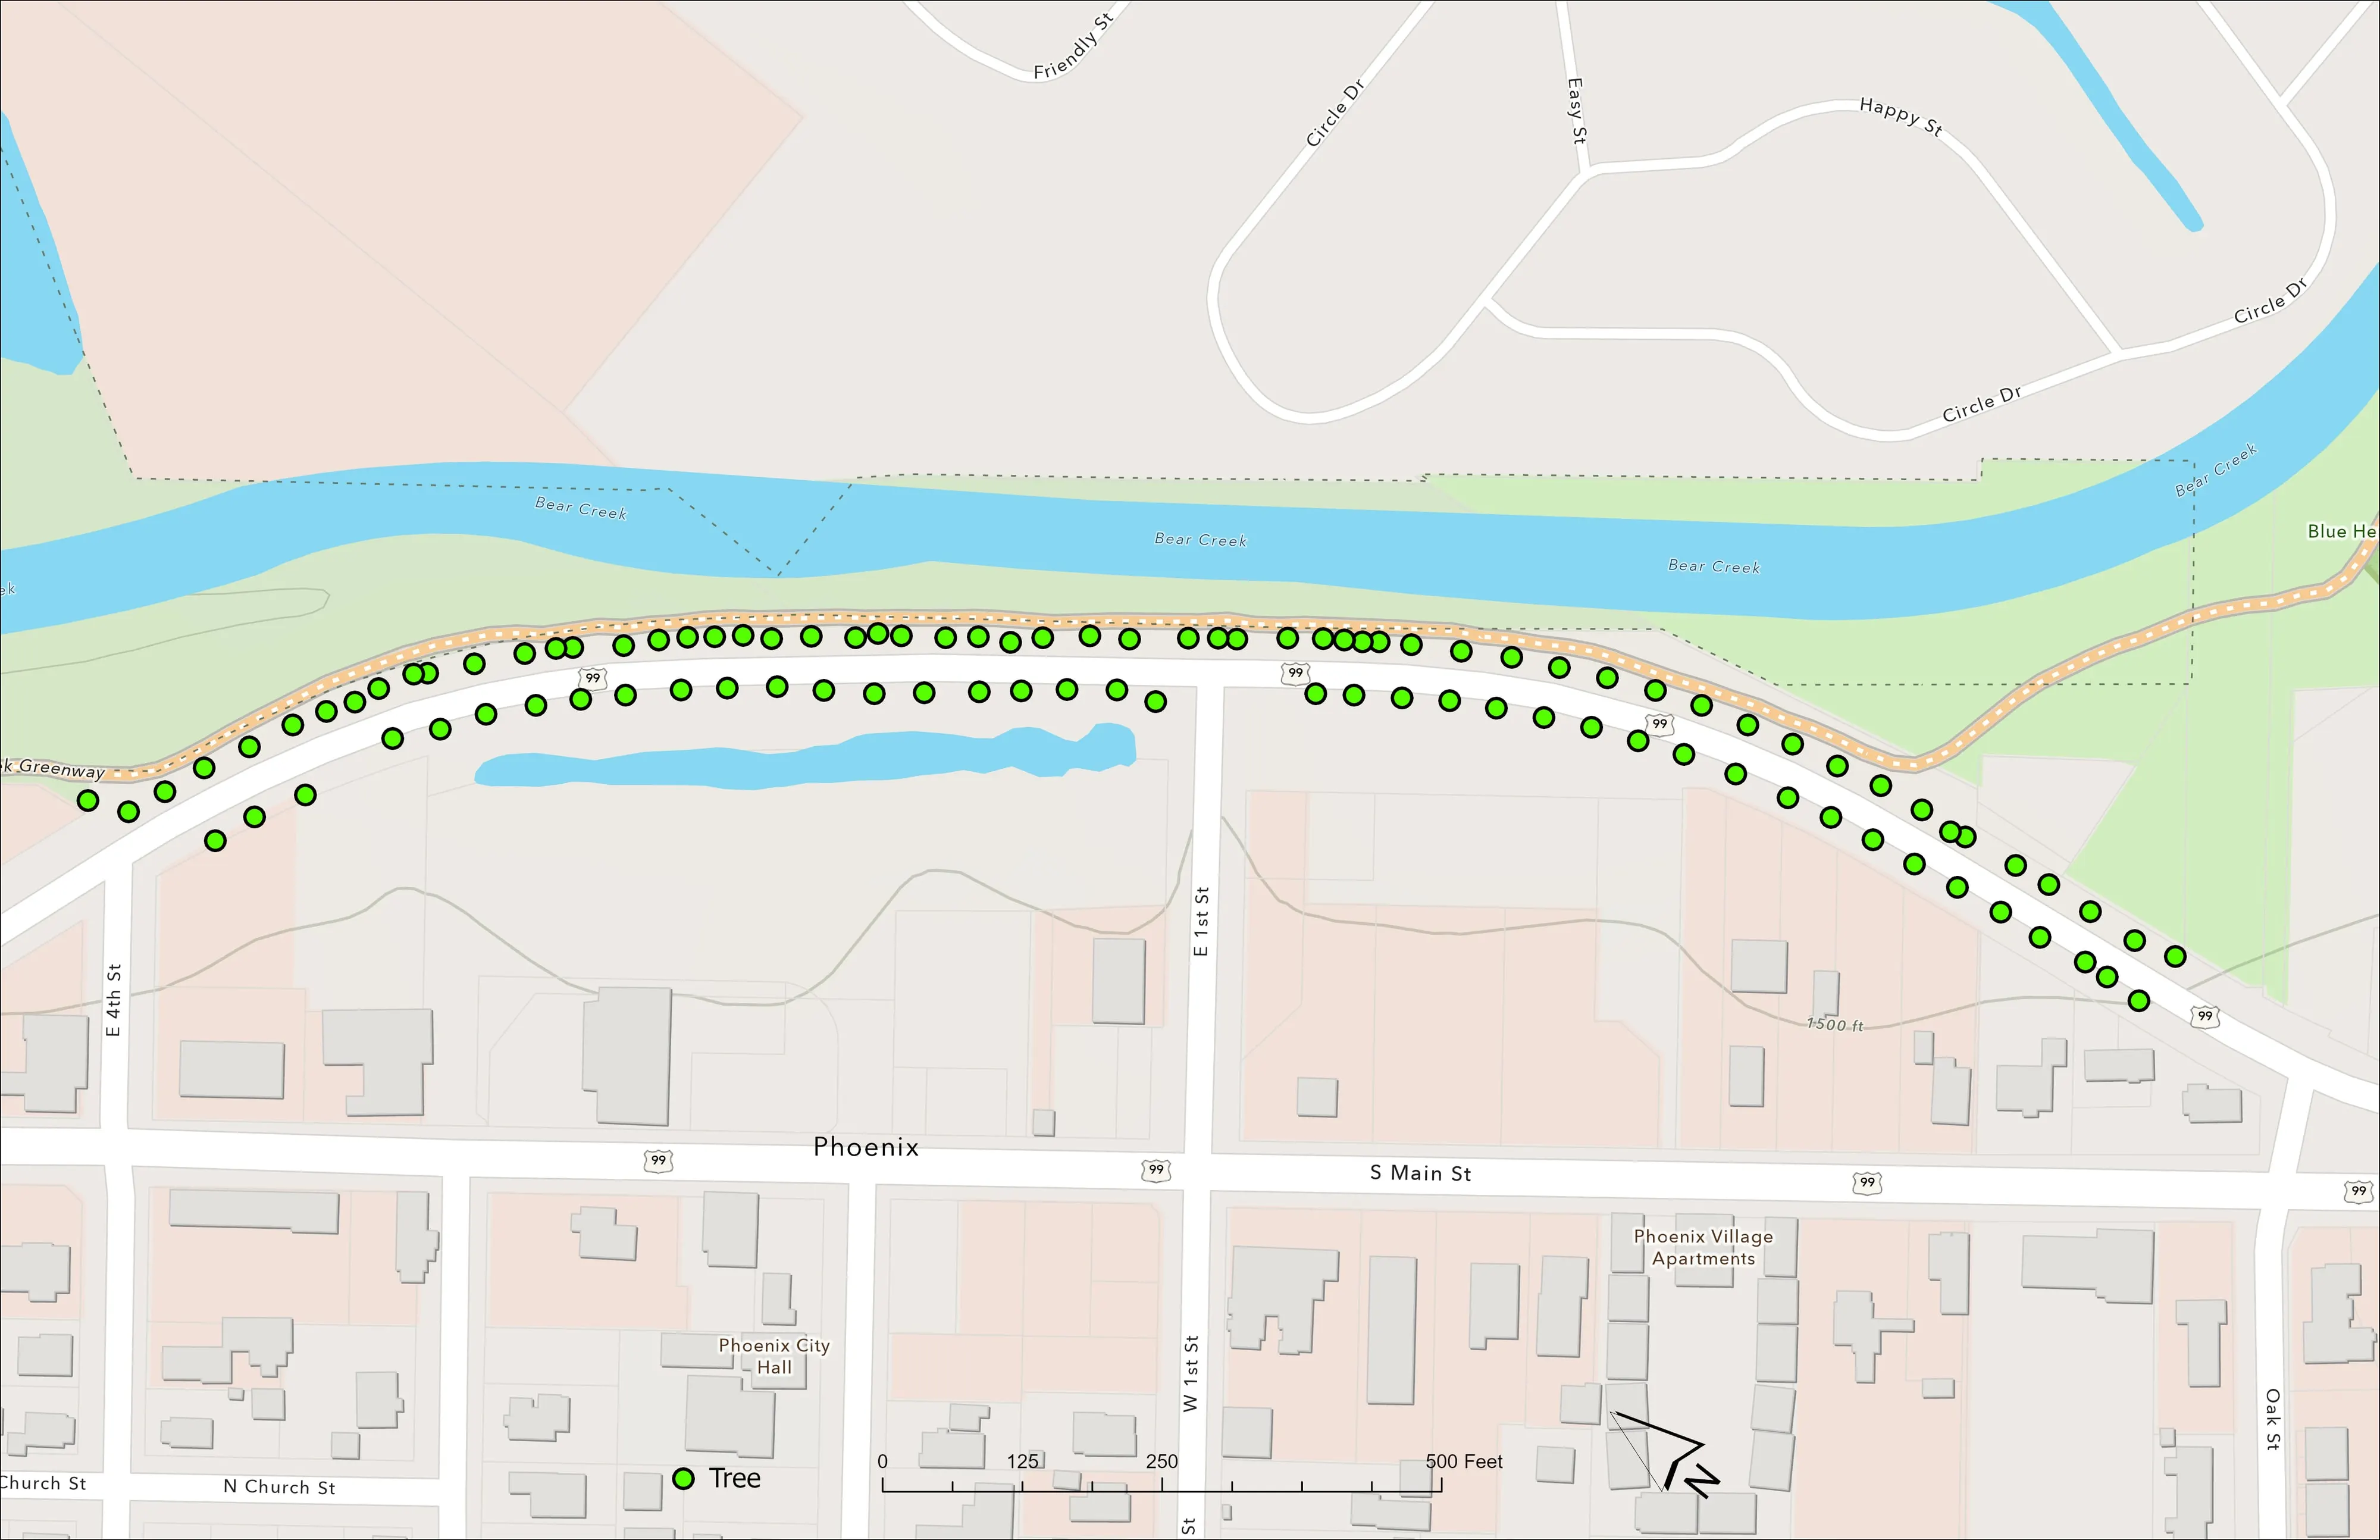
For the City of Phoenix we flew drone LiDAR and RGB over the Bear Creek Greenway and Highway 99 on June 16, 2025, 65 days after the city planted 98 trees along the corridor the Almeda fire burned through in 2020. Each tree came back as a point and a polygon with its height and canopy area, on top of the ground model and the orthomosaic. Flown again next year, the record says which trees grew, which did not, and by how much.
What Oregon now asks of a city
Canopy numbers are in the statute
ORS 526.520, from 2023, directs the State Forestry Department to acquire and maintain a statewide urban tree canopy assessment tool: canopy mapped at the census tract level, an inventory of trees on public lands, rights of way, green space and the comparison of pervious to impervious ground. A city that wants grant money for its trees will be asked for those numbers, and for a plan that cites them.
A canopy assessment from LiDAR gives a city its own numbers at its own resolution: cover by tract, by neighbourhood and by block, the height structure under it, and the inventory of public trees the statute names, all from one season of flying. The emerald ash borer plan, the hazard tree list and the planting plan come out of the same data.
What you get
Deliverables
- Crown polygons and treetop points, each with height, canopy area, species, health class and confidence
- A hosted layer your GIS and forestry staff work from, with a field form for the ground checks
- Canopy cover by block, park, neighbourhood or census tract
- Priority lists: dead and hazard trees, ash to treat or remove, gaps to plant
- Canopy height model, orthomosaic and the classified point cloud behind it all
- An accuracy statement on trees the model never saw, and a method note your council can read
- The same flight a year later, so the change is measured and not remembered
Who it is for
- City urban forestry and parks departments
- Counties, school districts and campuses with trees to manage and no inventory
- Watershed councils and restoration groups counting what they planted
- Homeowner associations and large private grounds
- Utilities with trees along a corridor
- Consulting arborists who need the whole city, not the trees they could walk to
Species and health are read from leaf on imagery flown in the right month for the species in question; stems and terrain are read from LiDAR flown leaf off. Say what the inventory has to answer and the flights are planned around the calendar, not the other way round.
Beyond the city limits
The same count on a stand, a corridor or a river
The method does not know it is in a city. The same crown by crown record serves a timber stand, a utility corridor, a riparian planting or a post harvest unit, and the fuels question a Community Wildfire Protection Plan asks starts from the same canopy data.
Forestry Fuels and mitigation mapping The GIS behind the inventory
Send us the city limits and the question.
A boundary, the species that worries you, and when the council needs numbers. We will come back with a flight plan, what it answers and what it would cost.
Email info@roguerecon.net or call 808 298 6290.