
The problem
A long duration fire with the perimeter moving between divisions, a crewed infrared flight that could not come every night, and an incident management team that needed to know each morning where the heat actually was before it committed crews to mopup.
What we flew
- Night infrared with the Matrice 300 RTK and the Zenmuse H20T, flown as a mapping mission after the incident's aircraft left for the night
- Fifteen operational nights between 21 July and 9 August 2026, division by division as the fire moved
- Eight divisions covered over the assignment
What we delivered
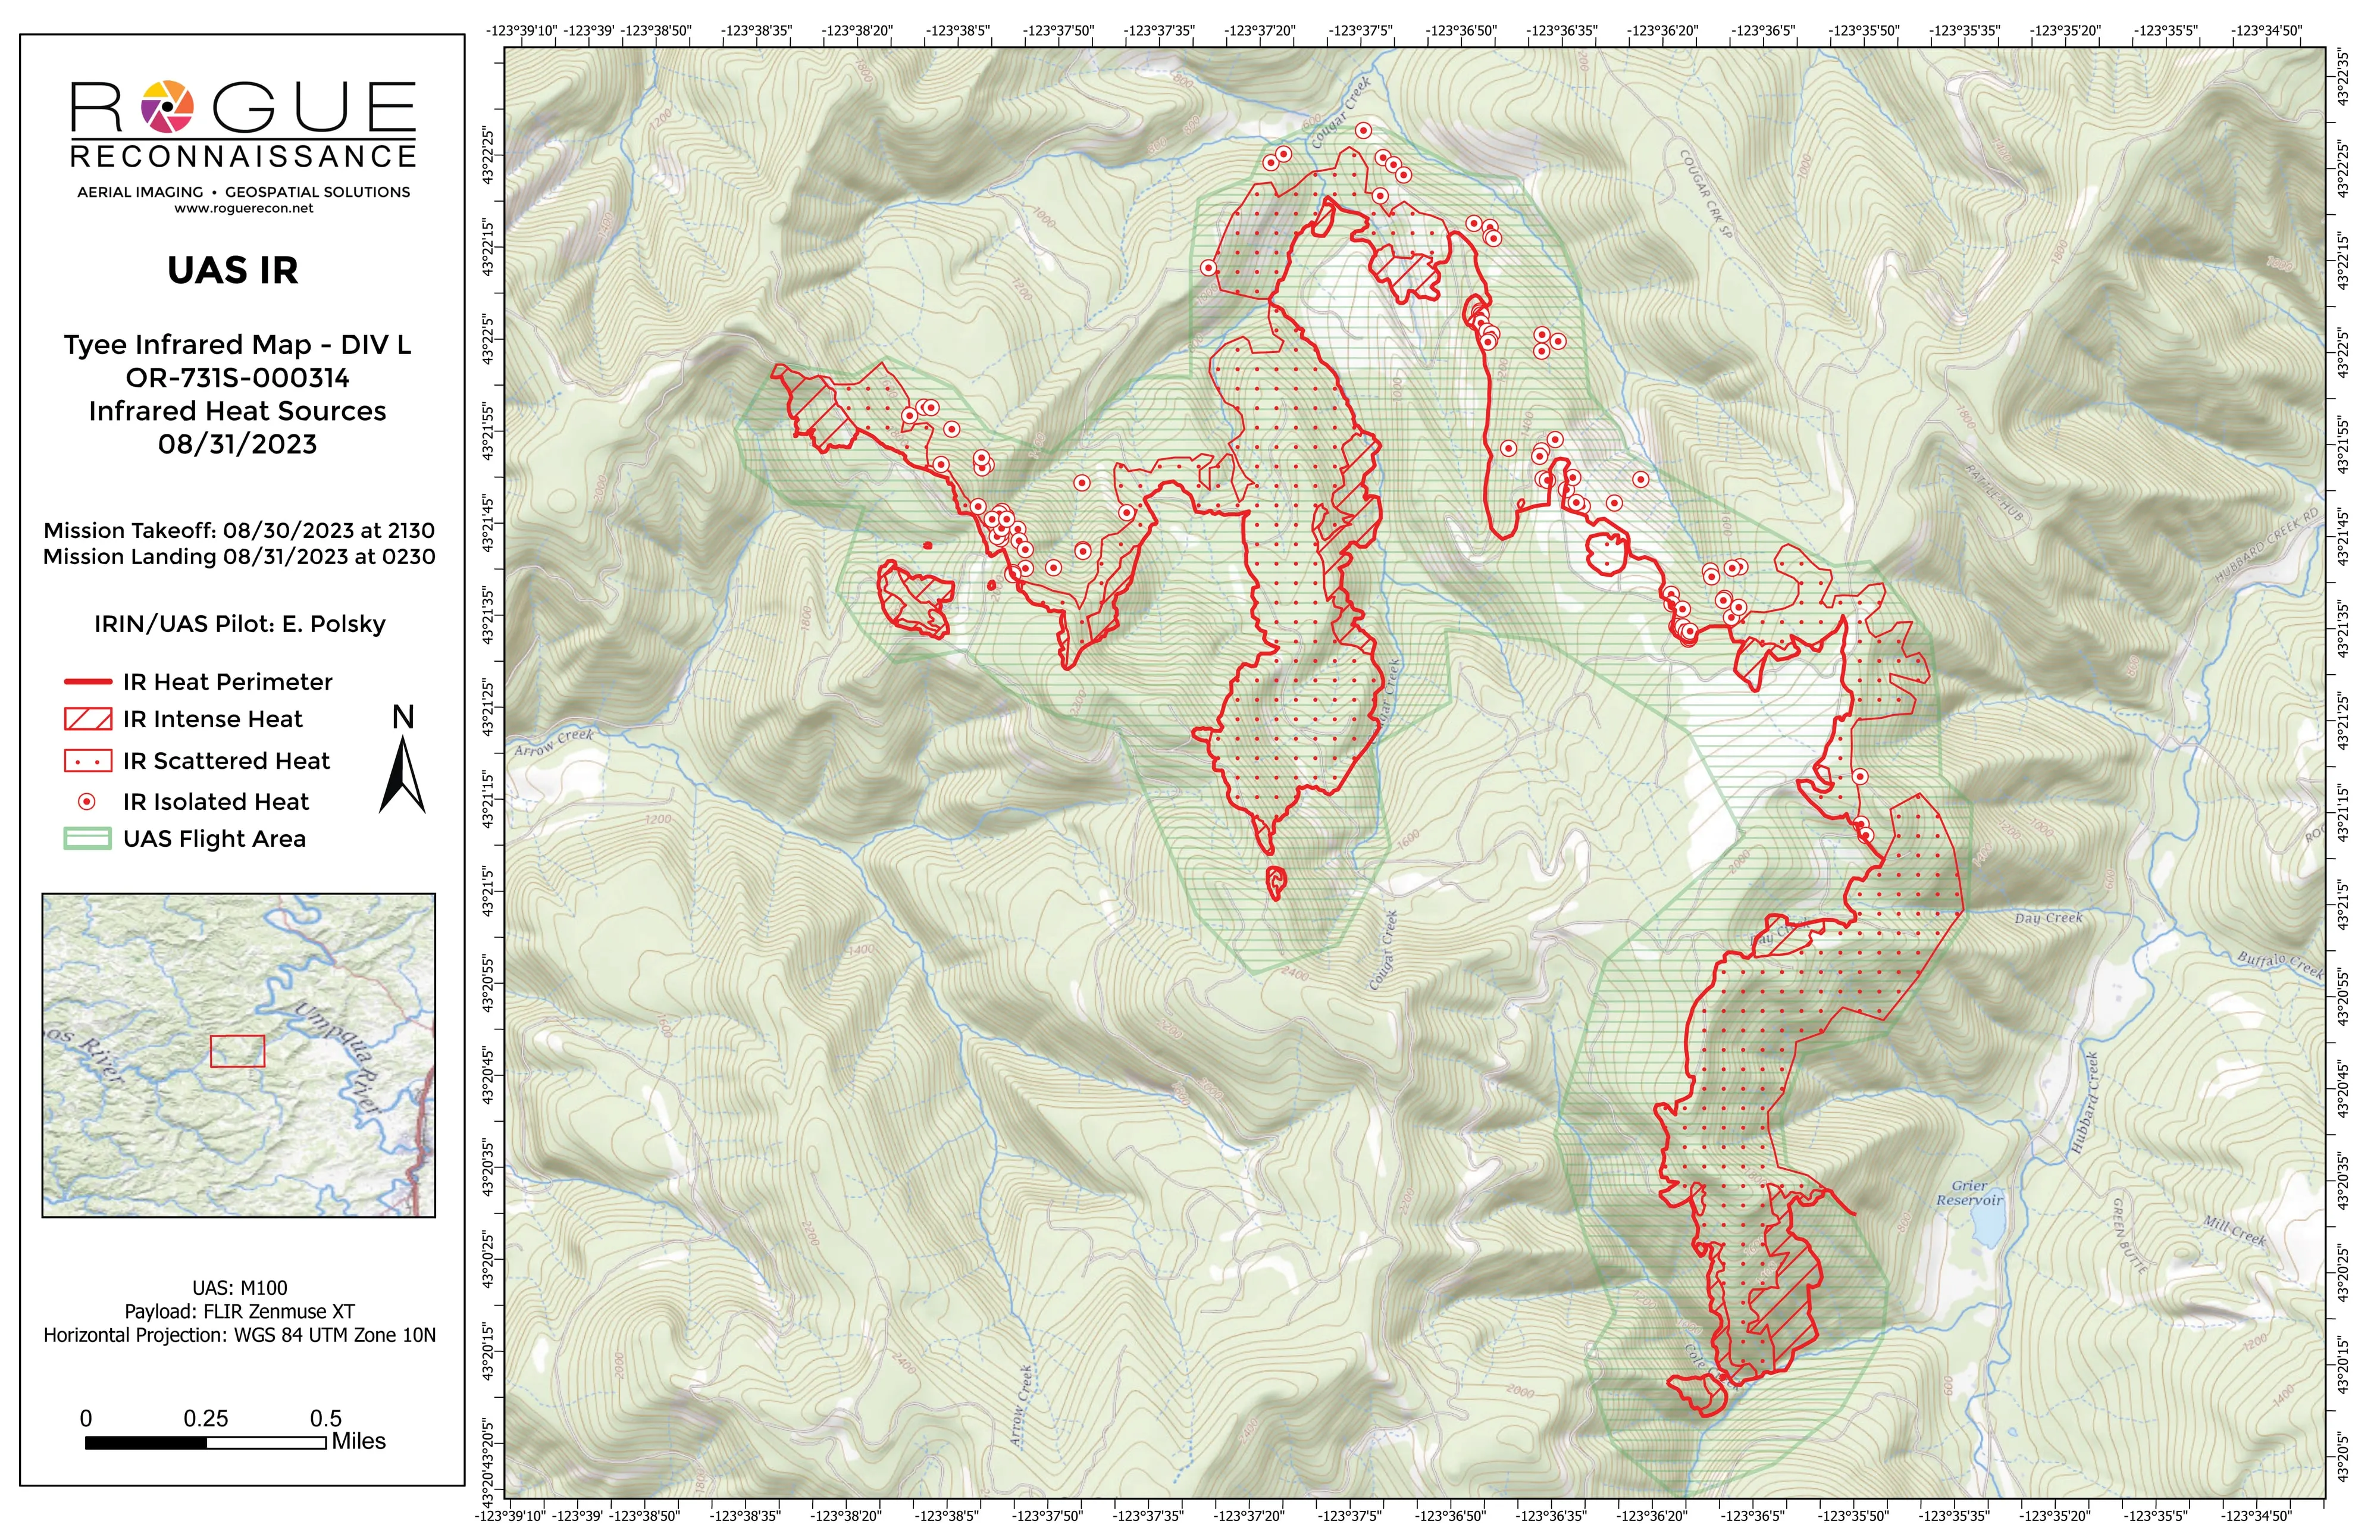
- Heat perimeter, intense and scattered heat, and isolated heat sources classed high, medium and low, in the schema the GIS specialist already works in
- Mopup buffers at the distance the division was working to, 300 feet on the Division A sheets
- Templated 11 by 17 sheets in aerial and topo pairs, with both operator logos and a QR to the live data
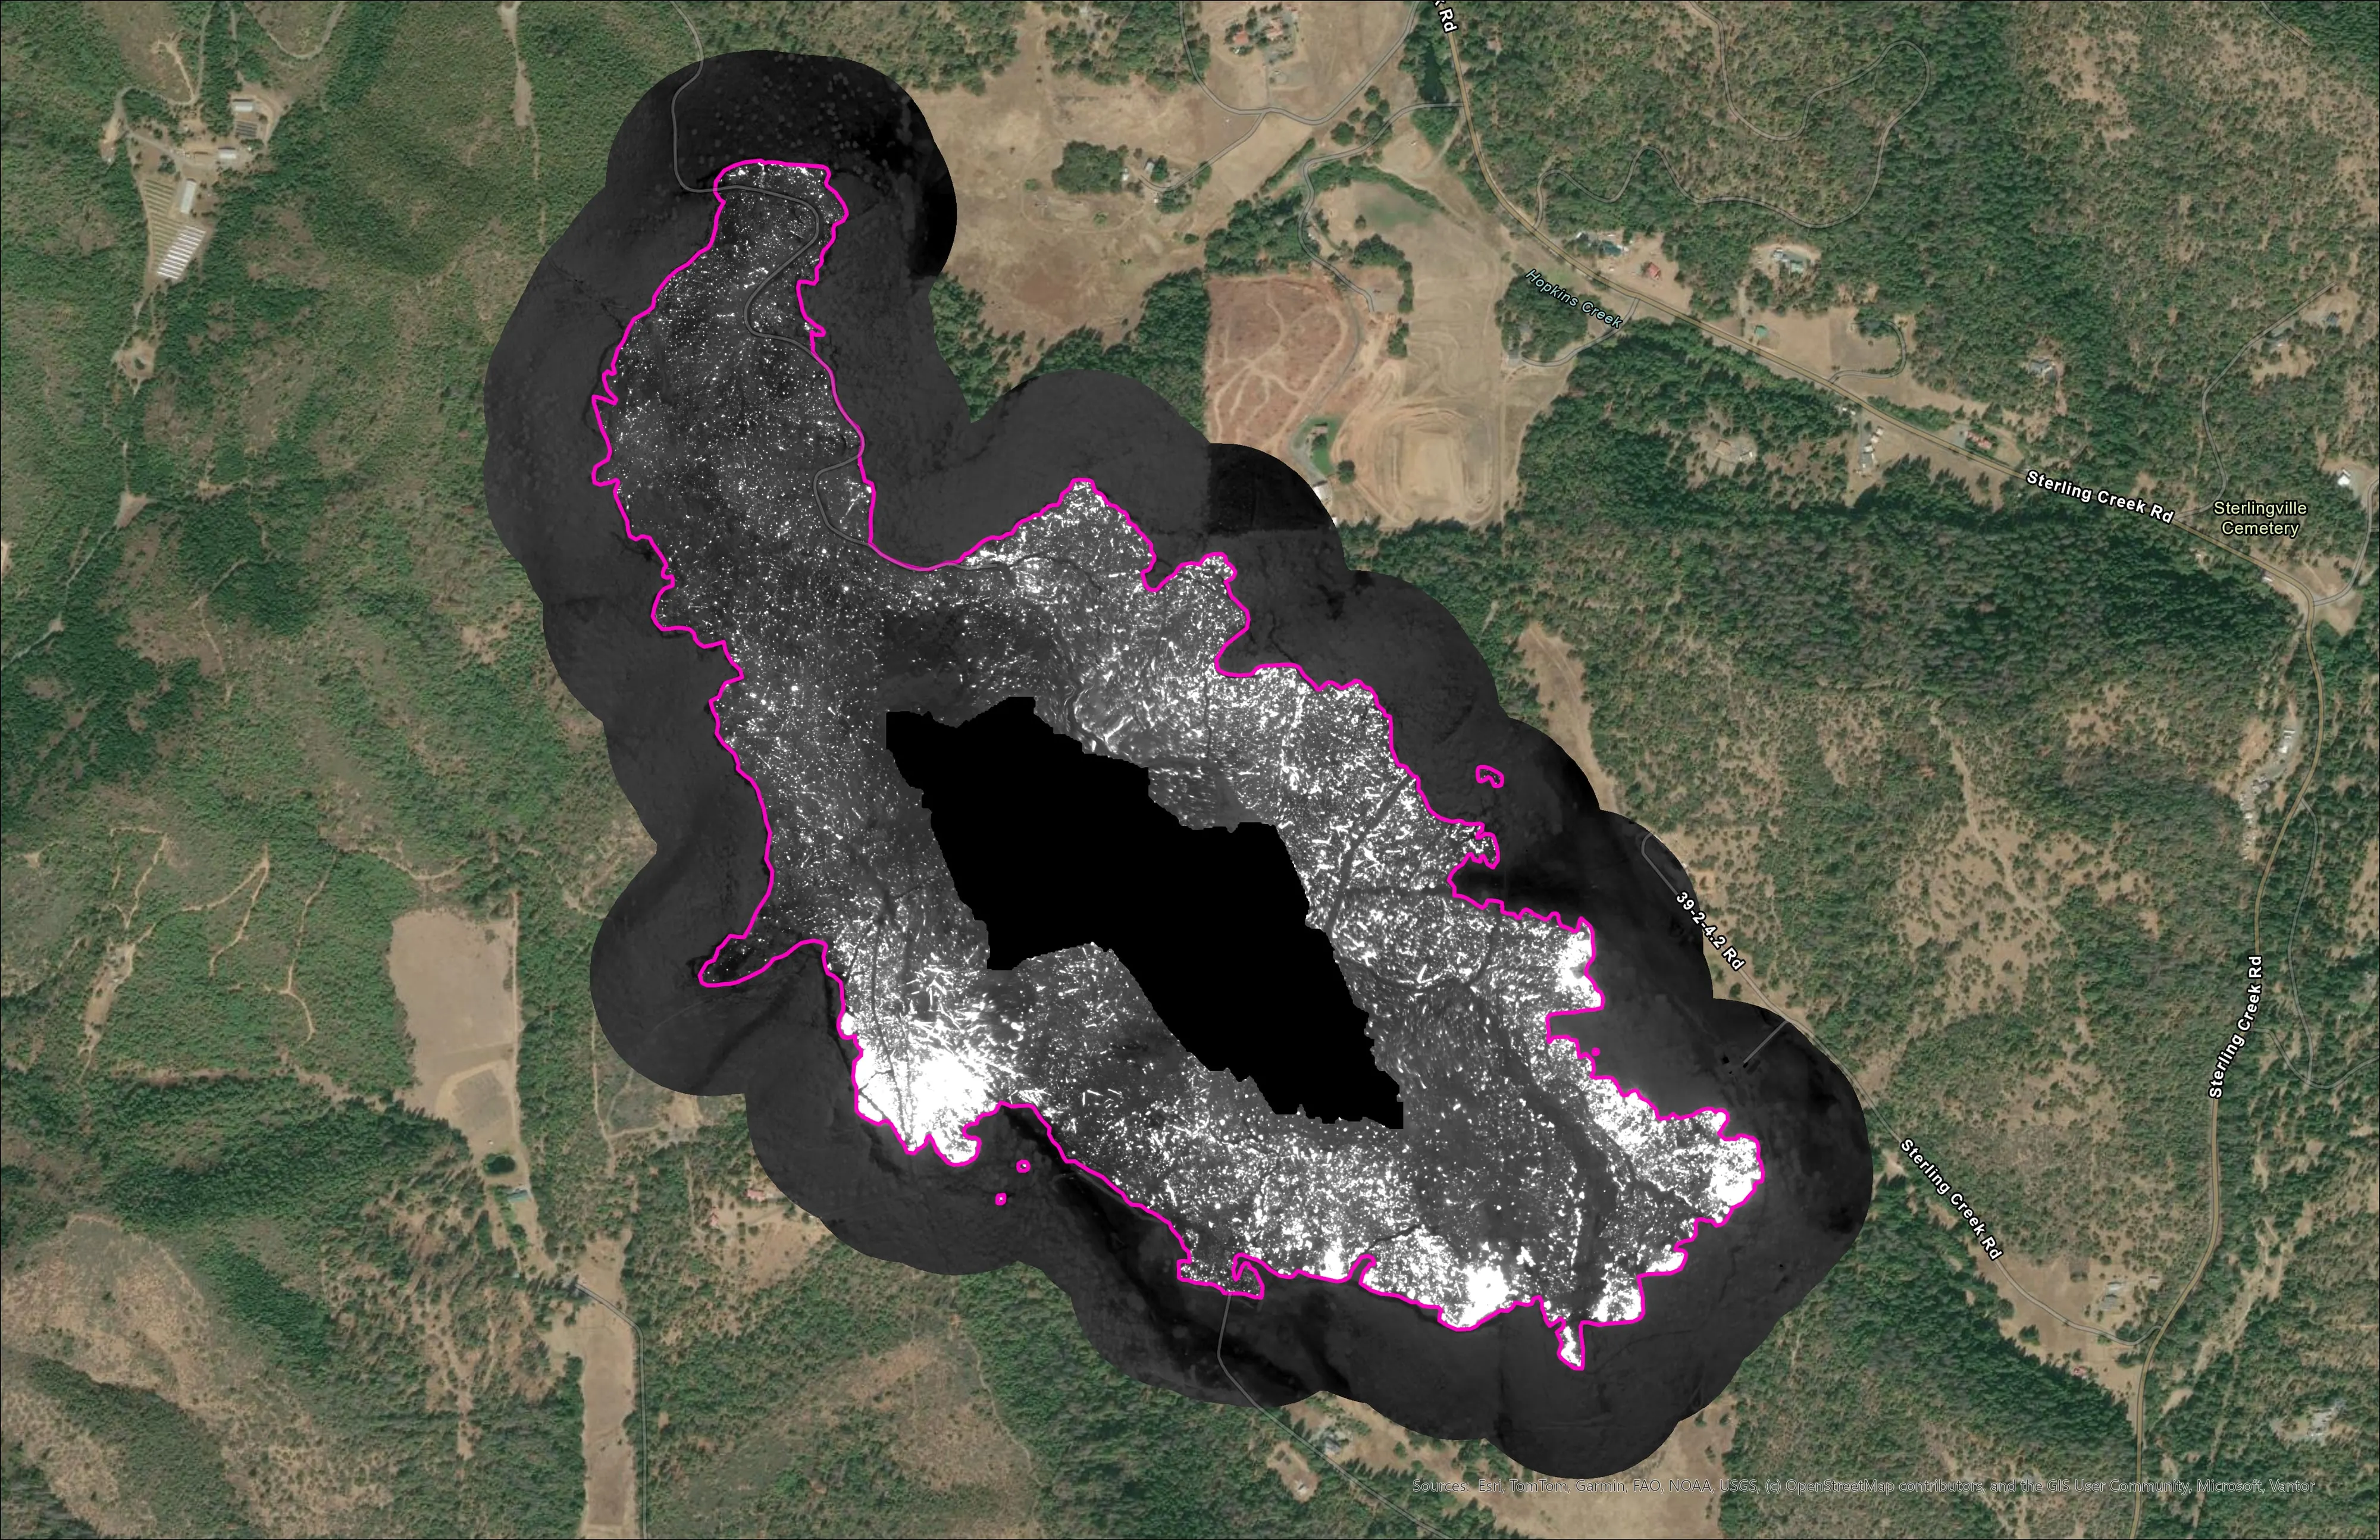
- File geodatabase, shapefile set, KMZ, and the orthorectified infrared GeoTIFF
- A UAS IR flight log for every operational period
Why a long fire is a different job
A single night of infrared is a picture. Fifteen nights is a record of how a fire behaves, and that is a different thing to deliver. The perimeter moves between divisions, yesterday’s intense heat becomes today’s scattered heat, and the question the incident asks each morning changes from where is the fire to where is it still hot enough to matter.
So the product has to be the same every night. Same schema, same classes, same file names, same place in the folder. A GIS specialist who has to relearn the package at four in the morning is a GIS specialist who stops opening it.
What the sheet actually shows
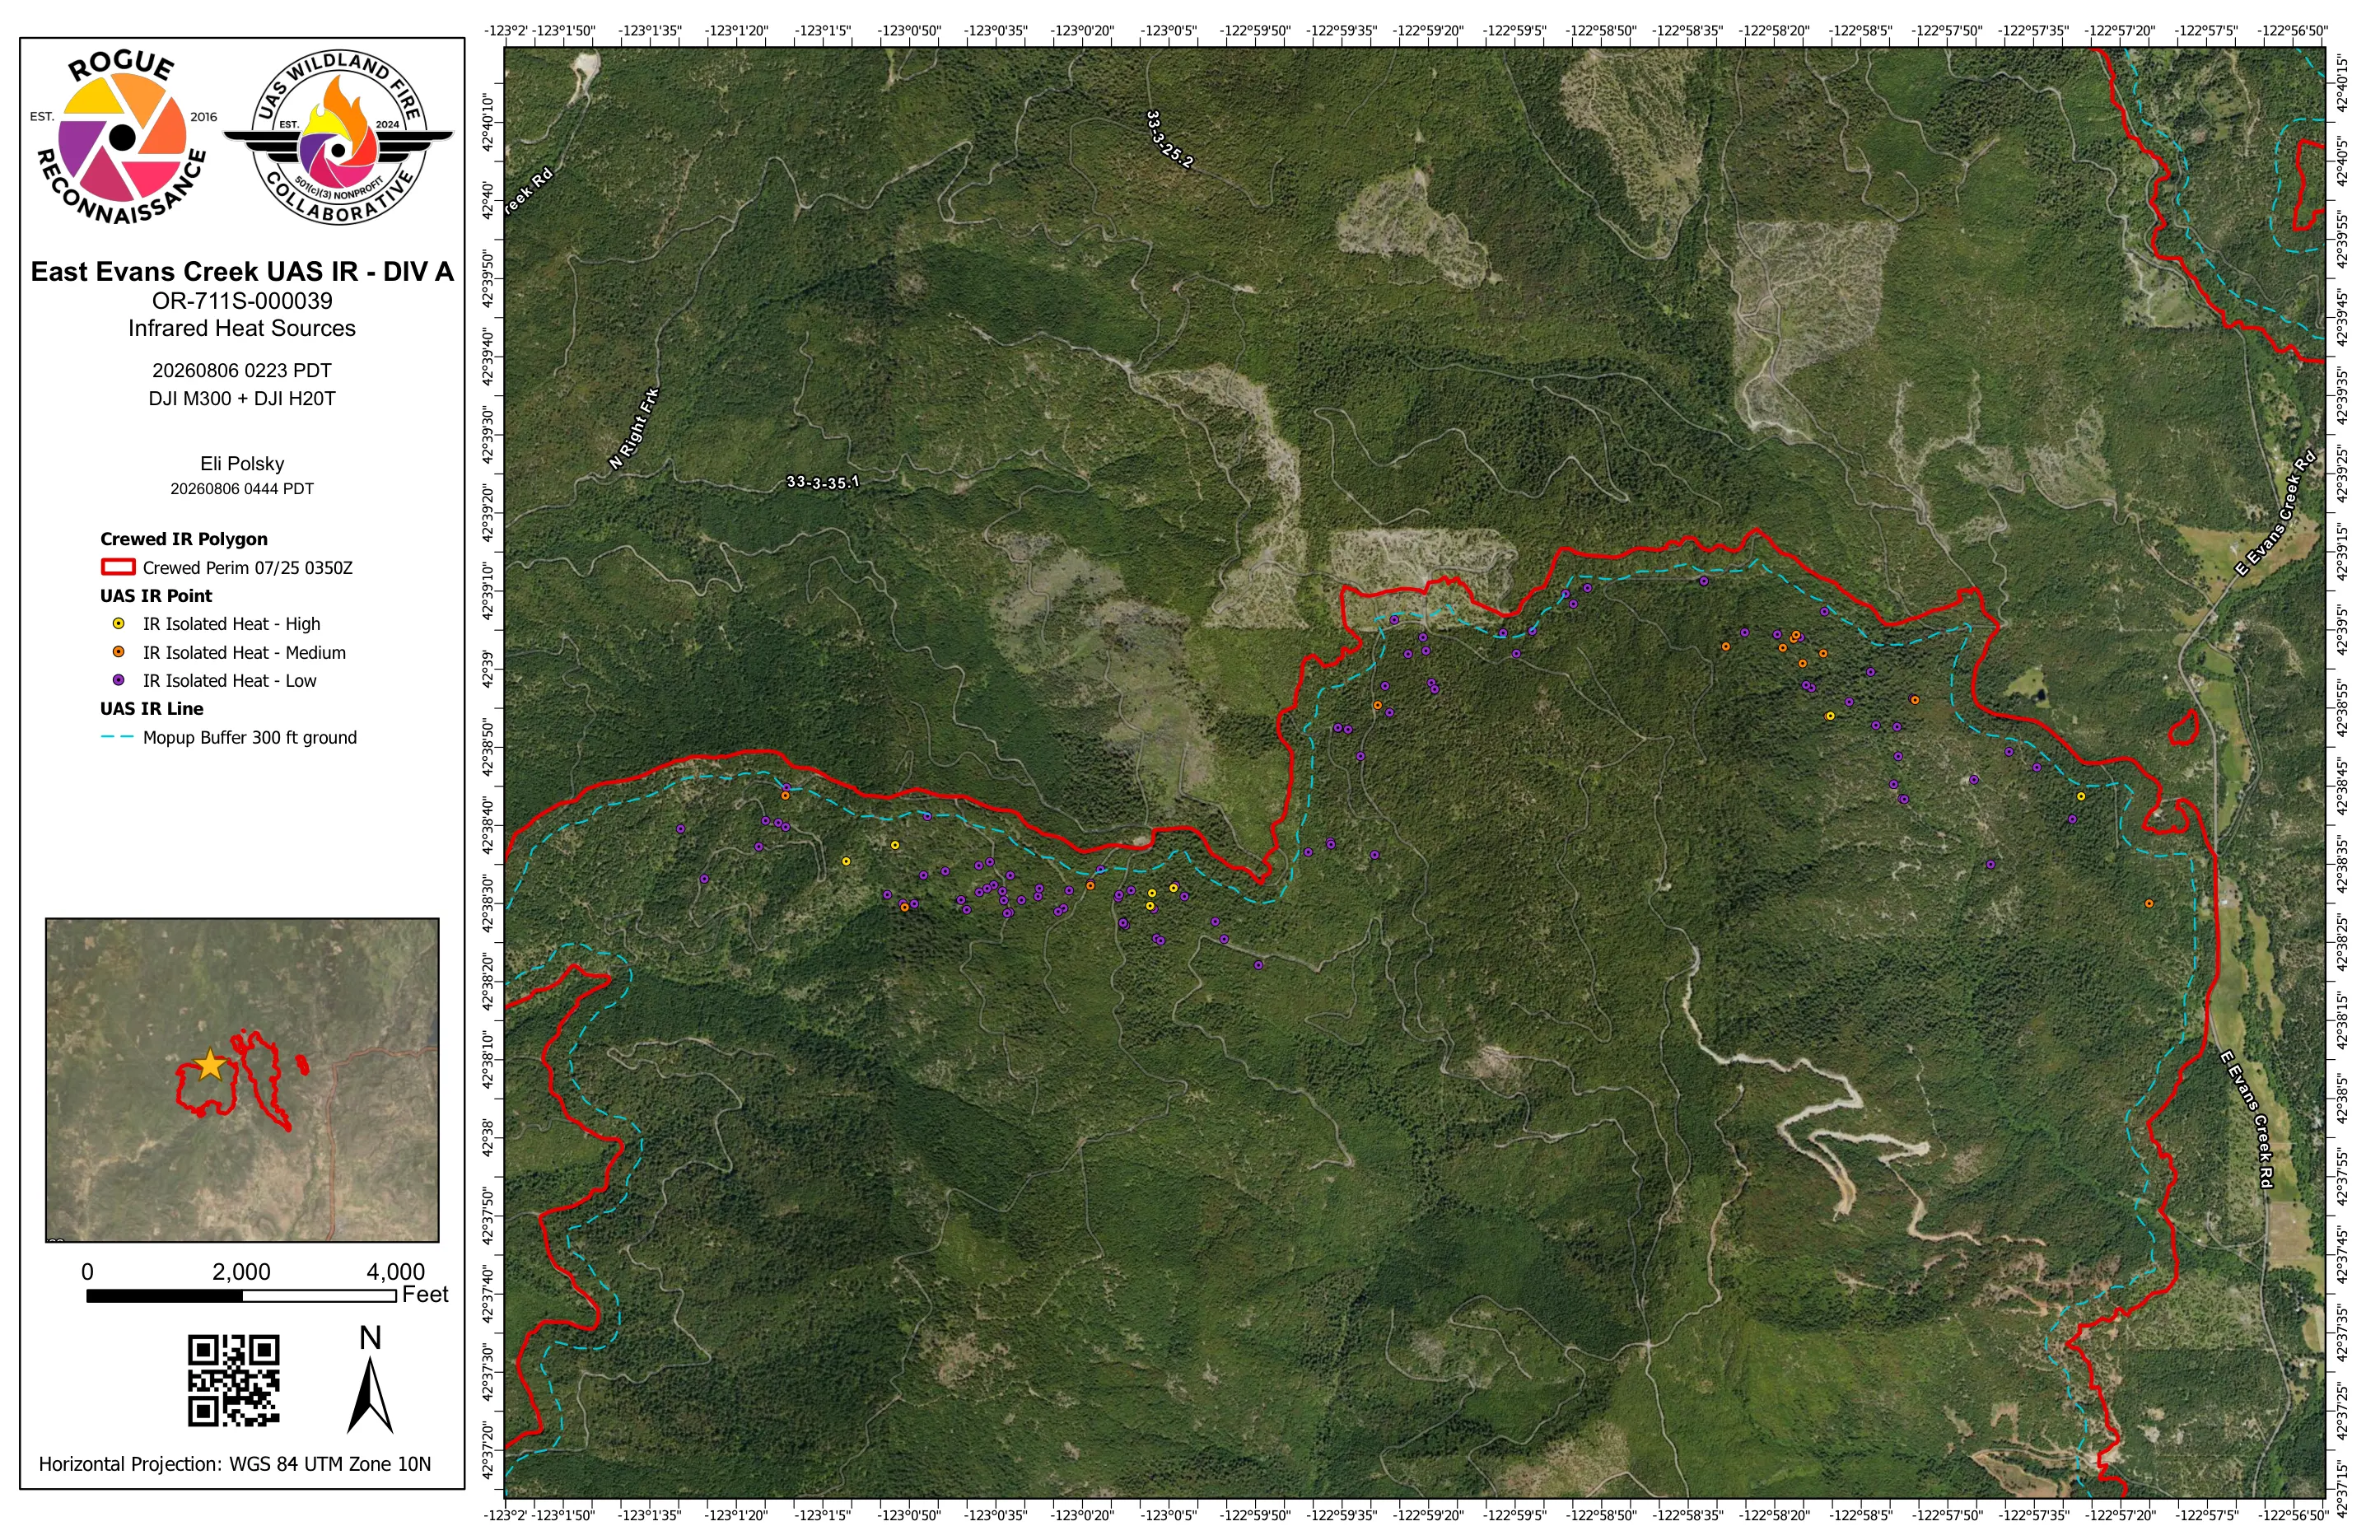
The Division A sheet from 6 August carries the crewed infrared perimeter in red, flown on 25 July, and our isolated heat sources on top of it classed high, medium and low. The two together are the point. The crewed flight gives the shape of the fire. The UAS flight, lower and later, gives the heat still inside it, down to individual sources a crew can walk to.
The dashed line is the mopup buffer, 300 feet on this division. Heat inside the buffer is a task with an edge on it. Heat outside it is a different conversation.
The turnaround is on the sheet
Every sheet prints its own flight time and its own delivery time, which means the turnaround is not a claim we make, it is a number the incident can check. Division A on 6 August: flown 0223, delivered 0444. Two hours and twenty one minutes from wheels up to a package in the incident’s hands, in time for the morning briefing.
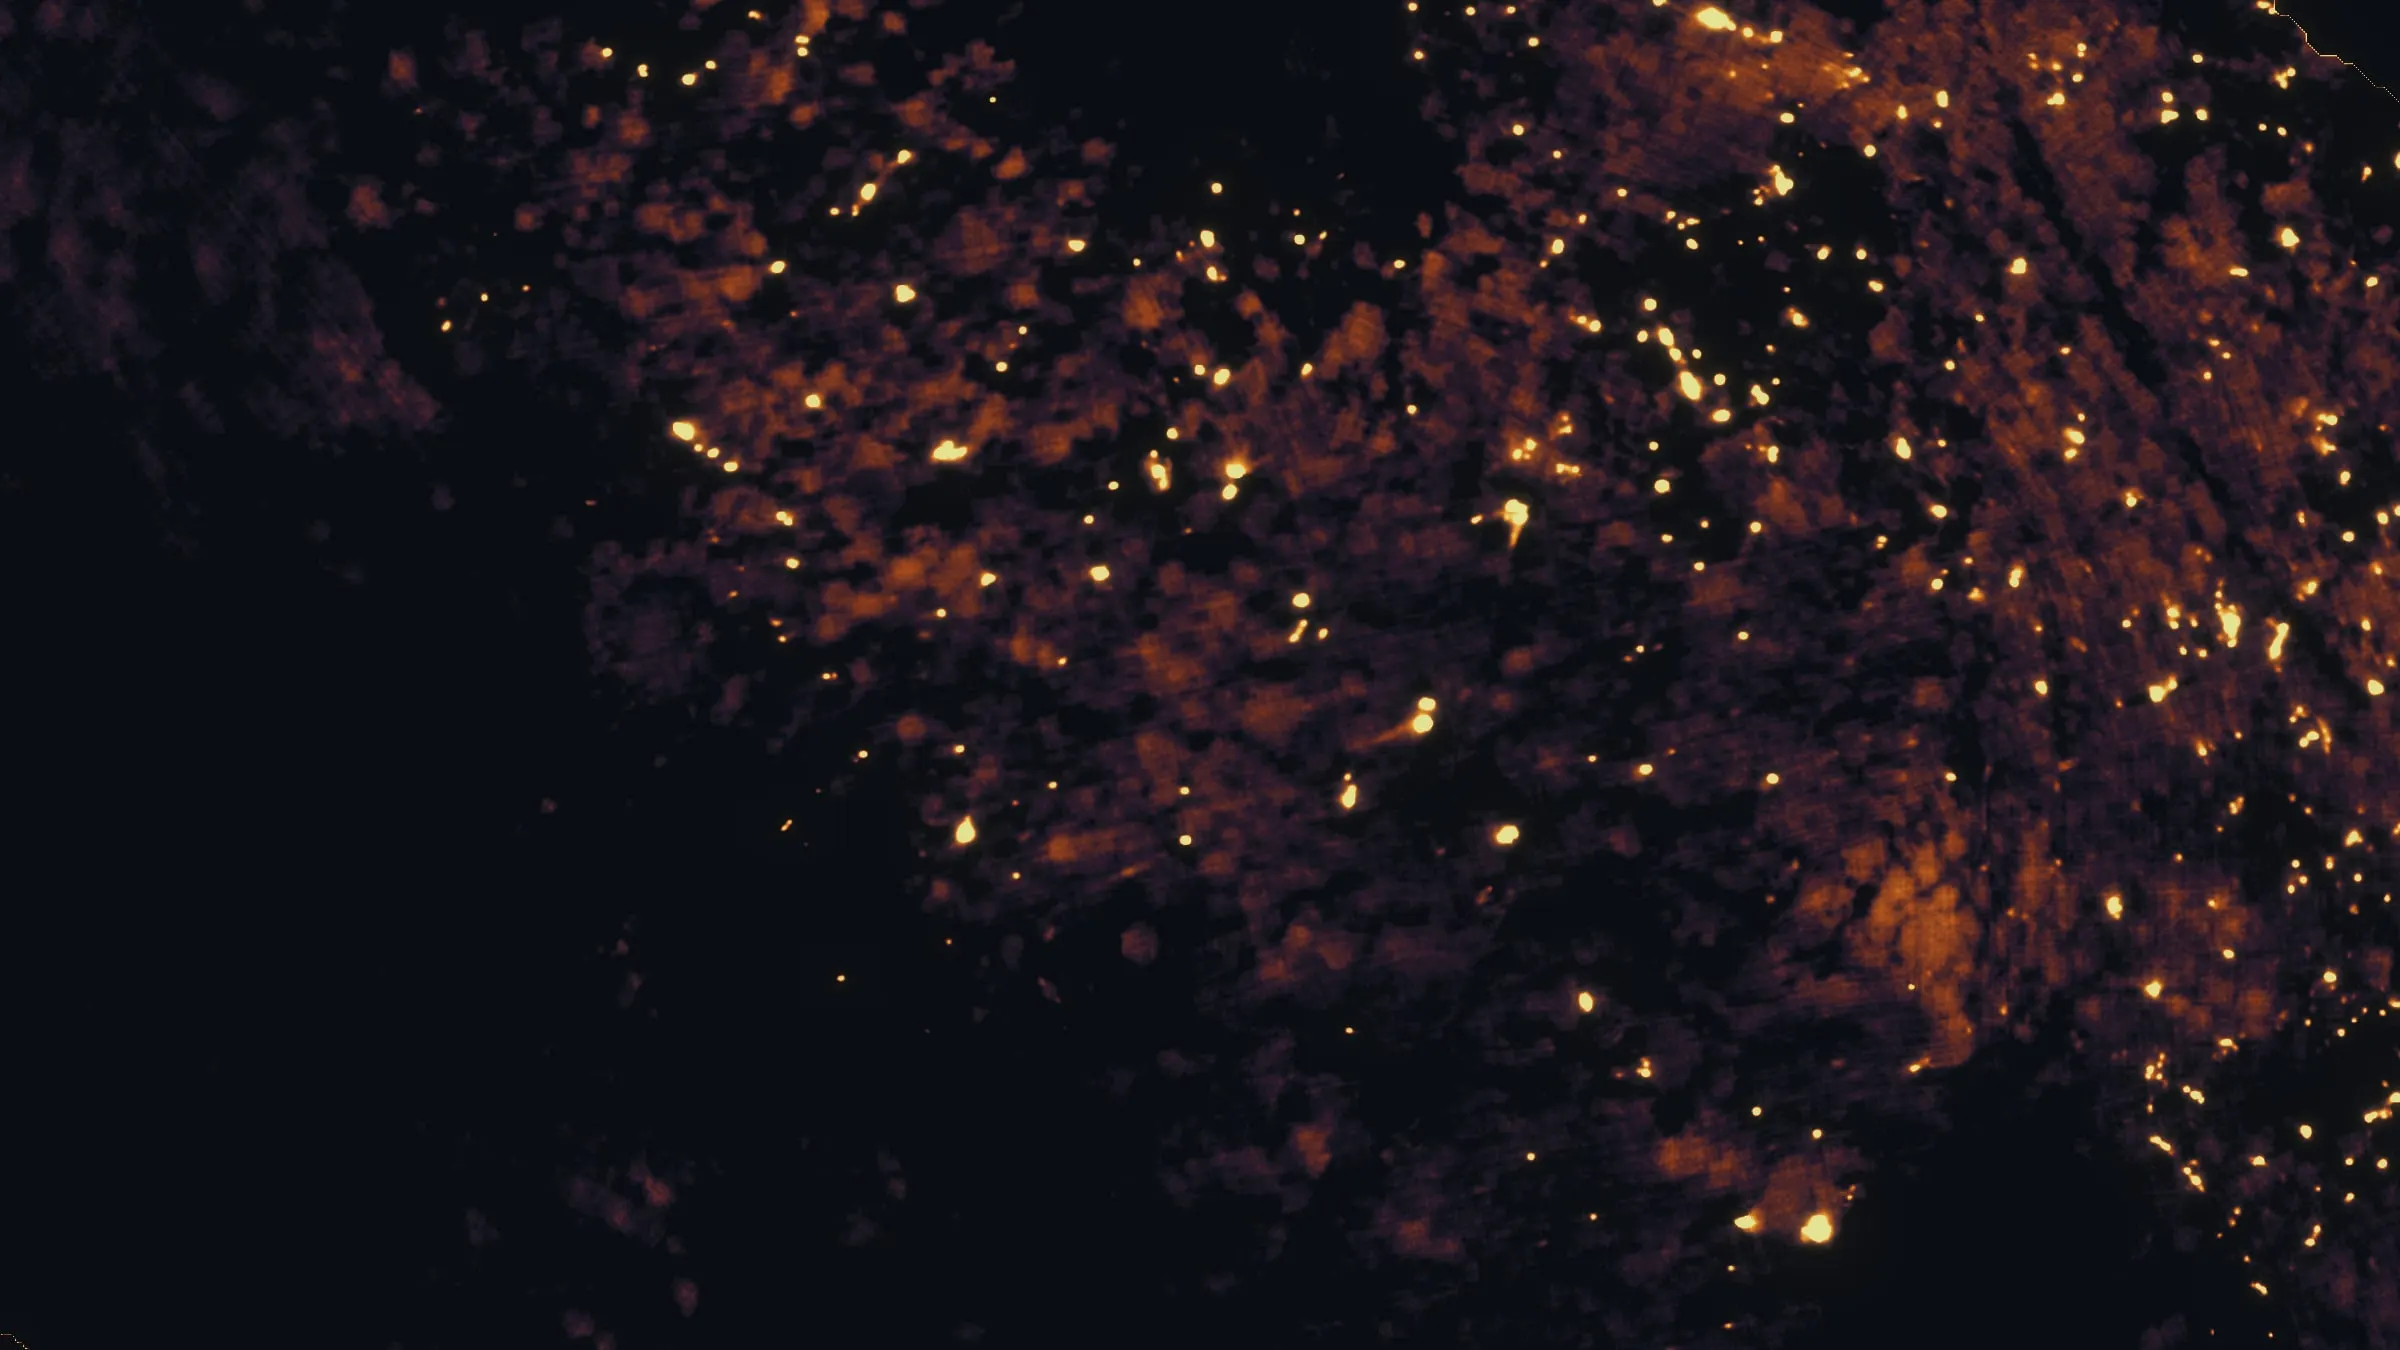
That is possible because the processing is not done afterwards in an office. The pipeline that turns the raw thermal export into the finished package runs in the field in about five minutes, and the rest of the time is flying and interpreting.
What it does not do
Infrared finds heat. It does not find every hotspot under a heavy canopy, and it does not tell you what a return is. A signature that looks warm but has not been confirmed is labelled possible heat, not a hotspot, and it stays labelled that way on the sheet. Deciding what to do about it is the incident’s call, made by people who can put eyes on it.